Analyze Model in Insight

00:03

Now that I have my mass model created in Revit,

00:06

I'm going to send it to Autodesk Insight for analysis and I can do that right inside of Revit.

00:14

We're in Revit 2024 again.

00:17

And from our recent files, let's click on option one, the model we created.

00:23

This has the massing model and the floor plates with it.

00:28

Now, in this particular view,

00:29

we don't see the massing model because Revit had only temporarily enabled that when we created the massing model.

00:38

So, let's go to our visibility graphics by typing in VG scrolling down to mass.

00:47

And checking on mass.

00:49

So, we can actually see the mass model.

00:52

Now, I could send this directly to Insight in its current state, but let's preset some of the conditions.

00:58

On the analyze tab, we have our energy optimization panel.

01:05

And within that, I can click on energy settings to preset some of the unique characteristics of this building.

01:14

I can set what mode it is, what my ground plane level is, which is level one,

01:20

the project phase is new construction, and a variety of other options.

01:26

Under my advanced.

01:27

Let's click on other options.

01:31

And here I can set some detailed information about the model.

01:35

For example, a percentage of glazing required, my slither space tolerance.

01:42

As I scroll down, I can click on what my outdoor air information is.

01:51

You can set those.

01:53

I can accept my conceptual types as to what type of construction I'm going to be using.

02:02

Currently, my schematic type is set to building.

02:05

I can look at what that means.

02:07

And basically, my construction type for building will consist of all these analytical construction types for the categories I click "OK".

02:17

Accept that.

02:19

I'm not making any changes. So, I simply click "OK" again.

02:23

And "OK" once again to exit our energy settings.

02:28

Now all these settings are going to affect how Insight does the analysis.

02:33

Once we're on the Insight page.

02:36

Speaking of that, let's go to the Insight page.

02:41

To do that, I click on "Generate" in my energy optimization.

02:47

A warning appears that Revit needs to generate an energy analytical model which can take some time.

02:55

But for this simple mass model, it's not going to take very long.

02:59

So, I simply accept that it's going to create the energy analytical model by clicking on that.

03:08

This is a cloud-based service.

03:11

Therefore, I receive an email from Autodesk telling me that the file has been received for the analysis.

03:21

When the analysis is complete I get another email from Autodesk informing me so.

03:28

Telling me that the analysis is complete for model option one.

03:35

And I can go into Insight to see the results.

03:42

As I said, it doesn't take very long and it tells me that the process is complete,

03:48

and the energy analytical model has been successfully created.

03:52

I click "OK".

03:56

To see the results on the energy optimization panel, I click on "Optimize".

04:04

This will launch the Insight page on your default internet browser.

04:11

In the top panel, we see our building form.

04:17

It acts very similar to many of the Autodesk viewers. I can zoom in and out.

04:23

I can go to first person. I have my view cube here.

04:28

I can switch the top panel to my location to find the location that we've picked earlier,

04:36

or I could toggle it back to my building form.

04:40

Below that you see a variety of different panels,

04:44

and you can rotate these pages to look at the variety of options I have for this particular aspect of the building.

04:52

These panels are known as widgets that are related to the key performance indicators.

04:58

So, I can see where my current building sits with regard to the various benchmarks,

05:03

specifically, the Ashray 90.1 and the architecture 2030.

05:11

Up in the top corner here, you see what our building energy cost per square foot is.

05:19

So, uh right now I'm at $18.90 in energy costs per square foot,

05:25

which is not bad compared to Ashray 90.1 or the architecture 2030.

05:34

But still, we can improve upon that.

05:37

And I do that by adjusting the various aspects within these widgets.

05:44

Now, let's look at some of these widgets.

05:47

If I scroll down, there is a widget for plug load efficiency.

05:52

Let's click on that.

05:57

Here, I can adjust my performance criteria to further reduce my costs.

06:05

Now, this triangle indicates that this is the current state of my model for my plug load efficiency,

06:13

but I can use these sliders at the bottom to adjust that.

06:20

And when I do, you see the energy cost mean improves.

06:26

So, I have a variety of options to play with to examine the various aspects indicated within these widgets.

06:35

In essence, I'm basically determining my performance criteria for my Model.

06:41

With the aid of these widgets, I'm using these to achieve particular energy cost performance.

06:48

Let's close this particular widget.

06:52

Next, let's look at lighting efficiency.

06:56

Now, when I see this line that is not flat, that indicates that I have some choices to play around with this.

07:03

Again, my triangle is my current state of my model and I can adjust these up and down.

07:11

And as I do, Insight automatically calculates the energy cost mean for this particular widget.

07:22

Looking at the tool tips that appear, as I hover over these dots, at the high end,

07:27

setting it up to 20.45 watts per meter squared, I will increase my cost by $3.37.

07:36

The low end, I can reduce my cost by $1.79.

07:42

Let's close out of the lighting efficiency panel.

07:46

And let's look at operating schedule.

07:50

Now, since my triangle is all receptive low end as I slide this, it's not really going to make any difference.

07:56

I can close out of that widget.

08:00

Let's go up and see what our current tally is.

08:03

It's not set to 13.8.

08:06

We've already reduced it to some degree.

08:09

Let's look at some other things.

08:11

For example, window glass for my south, my triangle indicates that I can't go too much further.

08:18

If I do reduce my window set, I can reduce it a little bit, but maybe for design purposes, I want to increase it.

08:25

So again, this will indicate what the cost of that design decision might be.

08:32

I'm going to leave it at the current value.

08:36

So, no changes and therefore no changes in design either.

08:44

A variety of other aspects we can look at.

08:47

Let's look at wall construction, scroll down to wall construction.

08:52

Oh. My triangle currently is quite high.

08:57

And I can see what will get affected as I reduce my wall construction thermal loss.

09:06

Let's set that up to this ratio right here.

09:12

R13 plus R10 metal, I'm going to save $3.47 per year per square meter.

09:22

Accept that.

09:25

Let's look HVAC system.

09:28

Currently, it's quite high based on the criteria that we set up in the massing model within Revit.

09:35

Let's change that all to a High Efficiency Package Terminal ACunit.

09:41

That reduced it quite a lot.

09:44

Well, I can keep going like that.

09:47

Any of these panels I can flip over again.

09:50

Let's look at window shading for the south.

09:53

That can always be a very interesting architectural design, but it's more or less flat line.

09:59

So, I'm not really going to gain very much with that.

10:02

So, I'm not going to make any changes to that.

10:05

We can go through all these panels.

10:08

One thing I want to look at is orientation.

10:15

The location I'm currently at doesn't make too much difference.

10:19

Let's just slide it down a little bit more.

10:22

So, it's facing uh zero degrees.

10:27

It looks pretty good.

10:28

Now, all these changes I'm making do not affect the Revit model.

10:31

I have to make note of the things that I'm changing and then go back to the design team within Revit,

10:37

the mechanical engineers, the HVAC systems,

10:41

and let them know how we can optimize this design based on these insights within Insight.

10:49

So, I'm doing quite well. I'm down to $9.72

10:54

and I'm in the orange zone.

10:56

I could reduce it further by chipping away at it.

10:59

But at this preliminary design, I would say, let's take that back into Revit,

11:03

make the adjustments necessary, and start furthering our design.

11:09

At any point, we can bring that back into Insight for some further analysis.

11:15

Before we exit Insight let's head back to the Insight page,

11:19

and record the changes that we made so that we can always look at this for analytical purposes.

11:26

Currently, we see that these are all the uncategorized models that were generated.

11:32

So, I'm going to go back to my main Insight page and I'm gonna create an Insight,

11:38

which is basically creating a folder.

11:40

And I'm going to add my current option one to it,

11:45

and the analysis that I did previously with option dash one.

11:50

I click that.

11:52

Now, it's untitled. It created a folder, but it's untitled.

11:56

So, I can click on these ellipses and rename it to headquarters.

12:04

I can also click on the ellipses to add new models to this,

12:08

or I could upload a picture of the current site or perhaps the client's name,

12:14

anything that will make it easier to identify this particular model.

12:19

When I click on headquarters, and because I have two models in here, I have a comparison between the two.

12:27

So, you can imagine as you keep going with this,

12:30

you're going to gather more and more models and especially as the model matures and develops,

12:36

we can have a detailed view of our energy consumptions.

Video transcript

00:03

Now that I have my mass model created in Revit,

00:06

I'm going to send it to Autodesk Insight for analysis and I can do that right inside of Revit.

00:14

We're in Revit 2024 again.

00:17

And from our recent files, let's click on option one, the model we created.

00:23

This has the massing model and the floor plates with it.

00:28

Now, in this particular view,

00:29

we don't see the massing model because Revit had only temporarily enabled that when we created the massing model.

00:38

So, let's go to our visibility graphics by typing in VG scrolling down to mass.

00:47

And checking on mass.

00:49

So, we can actually see the mass model.

00:52

Now, I could send this directly to Insight in its current state, but let's preset some of the conditions.

00:58

On the analyze tab, we have our energy optimization panel.

01:05

And within that, I can click on energy settings to preset some of the unique characteristics of this building.

01:14

I can set what mode it is, what my ground plane level is, which is level one,

01:20

the project phase is new construction, and a variety of other options.

01:26

Under my advanced.

01:27

Let's click on other options.

01:31

And here I can set some detailed information about the model.

01:35

For example, a percentage of glazing required, my slither space tolerance.

01:42

As I scroll down, I can click on what my outdoor air information is.

01:51

You can set those.

01:53

I can accept my conceptual types as to what type of construction I'm going to be using.

02:02

Currently, my schematic type is set to building.

02:05

I can look at what that means.

02:07

And basically, my construction type for building will consist of all these analytical construction types for the categories I click "OK".

02:17

Accept that.

02:19

I'm not making any changes. So, I simply click "OK" again.

02:23

And "OK" once again to exit our energy settings.

02:28

Now all these settings are going to affect how Insight does the analysis.

02:33

Once we're on the Insight page.

02:36

Speaking of that, let's go to the Insight page.

02:41

To do that, I click on "Generate" in my energy optimization.

02:47

A warning appears that Revit needs to generate an energy analytical model which can take some time.

02:55

But for this simple mass model, it's not going to take very long.

02:59

So, I simply accept that it's going to create the energy analytical model by clicking on that.

03:08

This is a cloud-based service.

03:11

Therefore, I receive an email from Autodesk telling me that the file has been received for the analysis.

03:21

When the analysis is complete I get another email from Autodesk informing me so.

03:28

Telling me that the analysis is complete for model option one.

03:35

And I can go into Insight to see the results.

03:42

As I said, it doesn't take very long and it tells me that the process is complete,

03:48

and the energy analytical model has been successfully created.

03:52

I click "OK".

03:56

To see the results on the energy optimization panel, I click on "Optimize".

04:04

This will launch the Insight page on your default internet browser.

04:11

In the top panel, we see our building form.

04:17

It acts very similar to many of the Autodesk viewers. I can zoom in and out.

04:23

I can go to first person. I have my view cube here.

04:28

I can switch the top panel to my location to find the location that we've picked earlier,

04:36

or I could toggle it back to my building form.

04:40

Below that you see a variety of different panels,

04:44

and you can rotate these pages to look at the variety of options I have for this particular aspect of the building.

04:52

These panels are known as widgets that are related to the key performance indicators.

04:58

So, I can see where my current building sits with regard to the various benchmarks,

05:03

specifically, the Ashray 90.1 and the architecture 2030.

05:11

Up in the top corner here, you see what our building energy cost per square foot is.

05:19

So, uh right now I'm at $18.90 in energy costs per square foot,

05:25

which is not bad compared to Ashray 90.1 or the architecture 2030.

05:34

But still, we can improve upon that.

05:37

And I do that by adjusting the various aspects within these widgets.

05:44

Now, let's look at some of these widgets.

05:47

If I scroll down, there is a widget for plug load efficiency.

05:52

Let's click on that.

05:57

Here, I can adjust my performance criteria to further reduce my costs.

06:05

Now, this triangle indicates that this is the current state of my model for my plug load efficiency,

06:13

but I can use these sliders at the bottom to adjust that.

06:20

And when I do, you see the energy cost mean improves.

06:26

So, I have a variety of options to play with to examine the various aspects indicated within these widgets.

06:35

In essence, I'm basically determining my performance criteria for my Model.

06:41

With the aid of these widgets, I'm using these to achieve particular energy cost performance.

06:48

Let's close this particular widget.

06:52

Next, let's look at lighting efficiency.

06:56

Now, when I see this line that is not flat, that indicates that I have some choices to play around with this.

07:03

Again, my triangle is my current state of my model and I can adjust these up and down.

07:11

And as I do, Insight automatically calculates the energy cost mean for this particular widget.

07:22

Looking at the tool tips that appear, as I hover over these dots, at the high end,

07:27

setting it up to 20.45 watts per meter squared, I will increase my cost by $3.37.

07:36

The low end, I can reduce my cost by $1.79.

07:42

Let's close out of the lighting efficiency panel.

07:46

And let's look at operating schedule.

07:50

Now, since my triangle is all receptive low end as I slide this, it's not really going to make any difference.

07:56

I can close out of that widget.

08:00

Let's go up and see what our current tally is.

08:03

It's not set to 13.8.

08:06

We've already reduced it to some degree.

08:09

Let's look at some other things.

08:11

For example, window glass for my south, my triangle indicates that I can't go too much further.

08:18

If I do reduce my window set, I can reduce it a little bit, but maybe for design purposes, I want to increase it.

08:25

So again, this will indicate what the cost of that design decision might be.

08:32

I'm going to leave it at the current value.

08:36

So, no changes and therefore no changes in design either.

08:44

A variety of other aspects we can look at.

08:47

Let's look at wall construction, scroll down to wall construction.

08:52

Oh. My triangle currently is quite high.

08:57

And I can see what will get affected as I reduce my wall construction thermal loss.

09:06

Let's set that up to this ratio right here.

09:12

R13 plus R10 metal, I'm going to save $3.47 per year per square meter.

09:22

Accept that.

09:25

Let's look HVAC system.

09:28

Currently, it's quite high based on the criteria that we set up in the massing model within Revit.

09:35

Let's change that all to a High Efficiency Package Terminal ACunit.

09:41

That reduced it quite a lot.

09:44

Well, I can keep going like that.

09:47

Any of these panels I can flip over again.

09:50

Let's look at window shading for the south.

09:53

That can always be a very interesting architectural design, but it's more or less flat line.

09:59

So, I'm not really going to gain very much with that.

10:02

So, I'm not going to make any changes to that.

10:05

We can go through all these panels.

10:08

One thing I want to look at is orientation.

10:15

The location I'm currently at doesn't make too much difference.

10:19

Let's just slide it down a little bit more.

10:22

So, it's facing uh zero degrees.

10:27

It looks pretty good.

10:28

Now, all these changes I'm making do not affect the Revit model.

10:31

I have to make note of the things that I'm changing and then go back to the design team within Revit,

10:37

the mechanical engineers, the HVAC systems,

10:41

and let them know how we can optimize this design based on these insights within Insight.

10:49

So, I'm doing quite well. I'm down to $9.72

10:54

and I'm in the orange zone.

10:56

I could reduce it further by chipping away at it.

10:59

But at this preliminary design, I would say, let's take that back into Revit,

11:03

make the adjustments necessary, and start furthering our design.

11:09

At any point, we can bring that back into Insight for some further analysis.

11:15

Before we exit Insight let's head back to the Insight page,

11:19

and record the changes that we made so that we can always look at this for analytical purposes.

11:26

Currently, we see that these are all the uncategorized models that were generated.

11:32

So, I'm going to go back to my main Insight page and I'm gonna create an Insight,

11:38

which is basically creating a folder.

11:40

And I'm going to add my current option one to it,

11:45

and the analysis that I did previously with option dash one.

11:50

I click that.

11:52

Now, it's untitled. It created a folder, but it's untitled.

11:56

So, I can click on these ellipses and rename it to headquarters.

12:04

I can also click on the ellipses to add new models to this,

12:08

or I could upload a picture of the current site or perhaps the client's name,

12:14

anything that will make it easier to identify this particular model.

12:19

When I click on headquarters, and because I have two models in here, I have a comparison between the two.

12:27

So, you can imagine as you keep going with this,

12:30

you're going to gather more and more models and especially as the model matures and develops,

12:36

we can have a detailed view of our energy consumptions.

To explore the Autodesk Insight application, an Energy Analytical Model is required. For that, a mass model has been created in Revit (in the previous unit’s exercise) that you can send to Autodesk Insight for analysis. This can be done right inside of Revit.

  1. In Revit, open the Option-1 file from the Recent Files section on the Home page.
  2. Go to the Default 3D view.
  3. This view doesn't show the massing model, so you need to use the Visibility/Graphic Overrides to display the mass. Type VG to open the dialog box.
  4. In the Visibility/Graphic Overrides dialog box, scroll down to Mass and check the checkbox in the Visibility column.


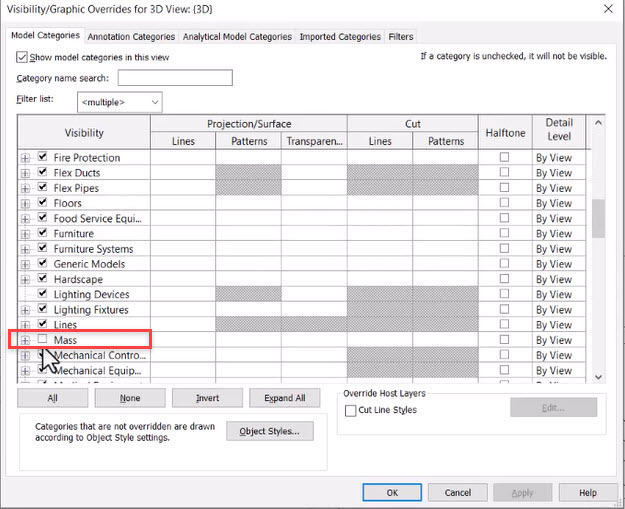
  5. Click OK to apply the changes and close the Visibility/Graphic Overrides dialog box.
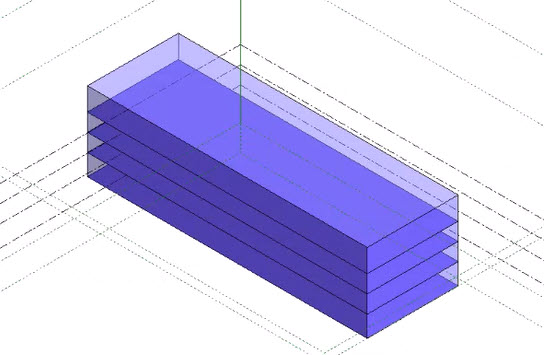
  6. The mass and the mass floors now display, as shown below.


    You could send this directly to Autodesk Insight in its current state, but first you’ll review some of the conditions.

  7. In the Analyze tab>Energy Optimization panel, click Energy Settings.
  8. Review the various settings listed. Click Edit… next to Other Options in the Advanced section and review those settings as well.


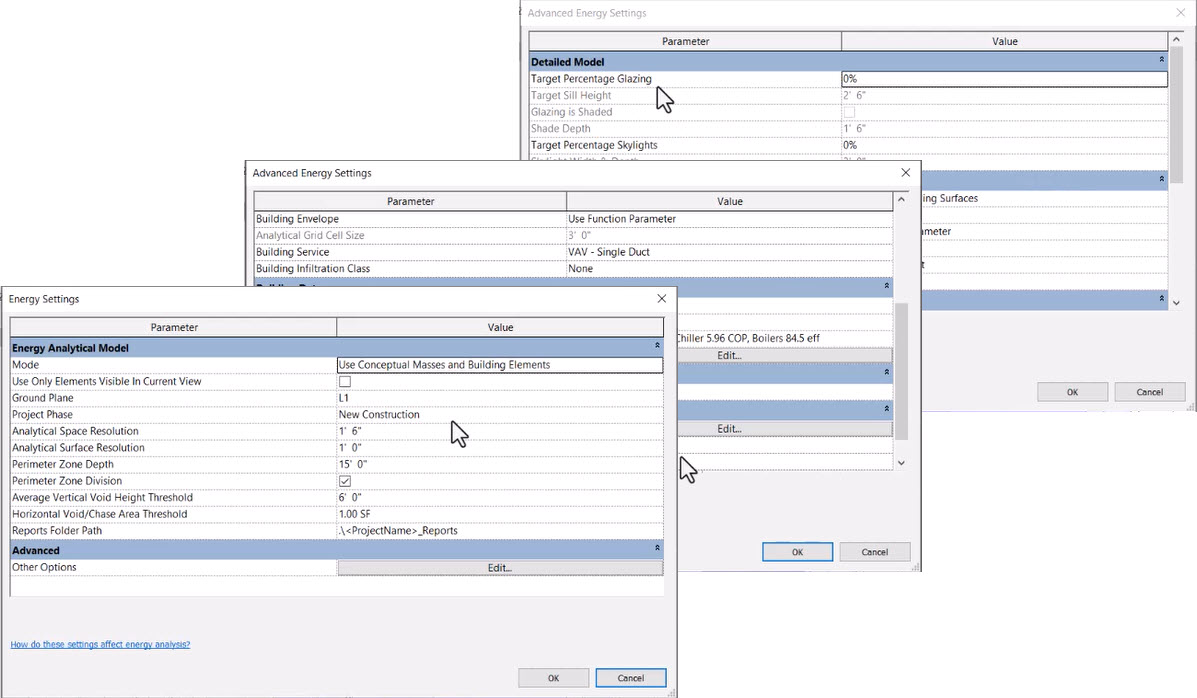
  9. You do not need to make any changes, so click OK when finished reviewing the Advanced Energy Settings, then click OK twice more to exit the Energy Settings.
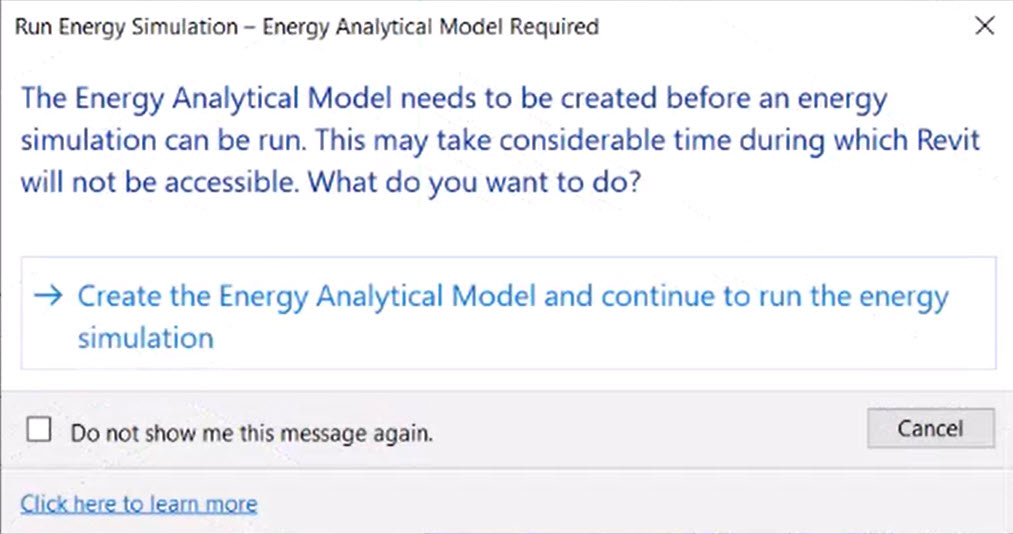
  10. In the Analyze tab>Energy Optimization panel, click Generate. A warning appears that Revit needs to generate an energy analytical model, which can take some time. Accept this by clicking Create the Energy Analytical Model...


  11. Two emails from Autodesk will be sent out, one indicating that the file has been received for the analysis and the other when the analysis is complete. Revit will also display a message that the process is complete.
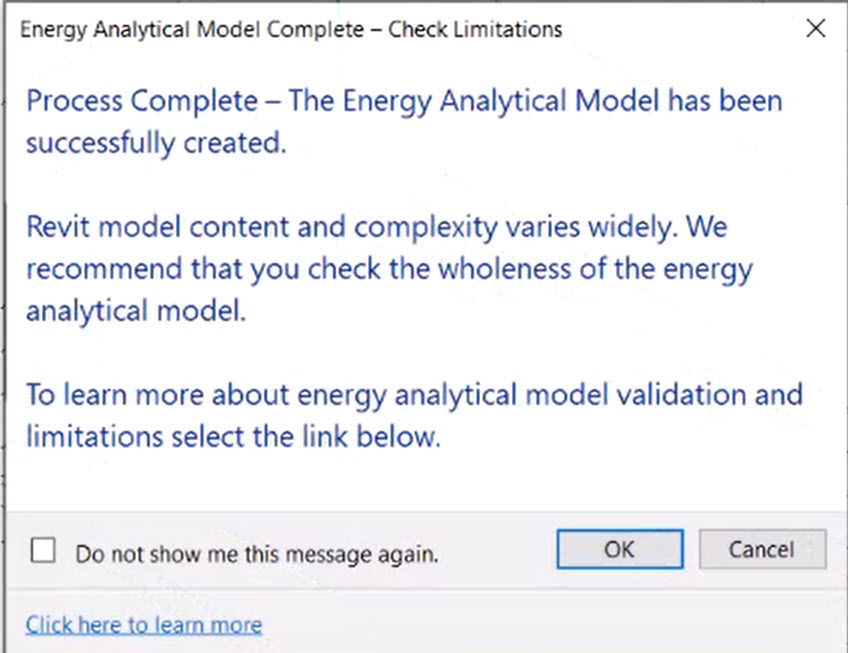


  12. Click OK.
  13. To see the results, in the Analyze tab>Energy Optimization panel, click Optimize. This will launch the Insight page in your default Internet browser.


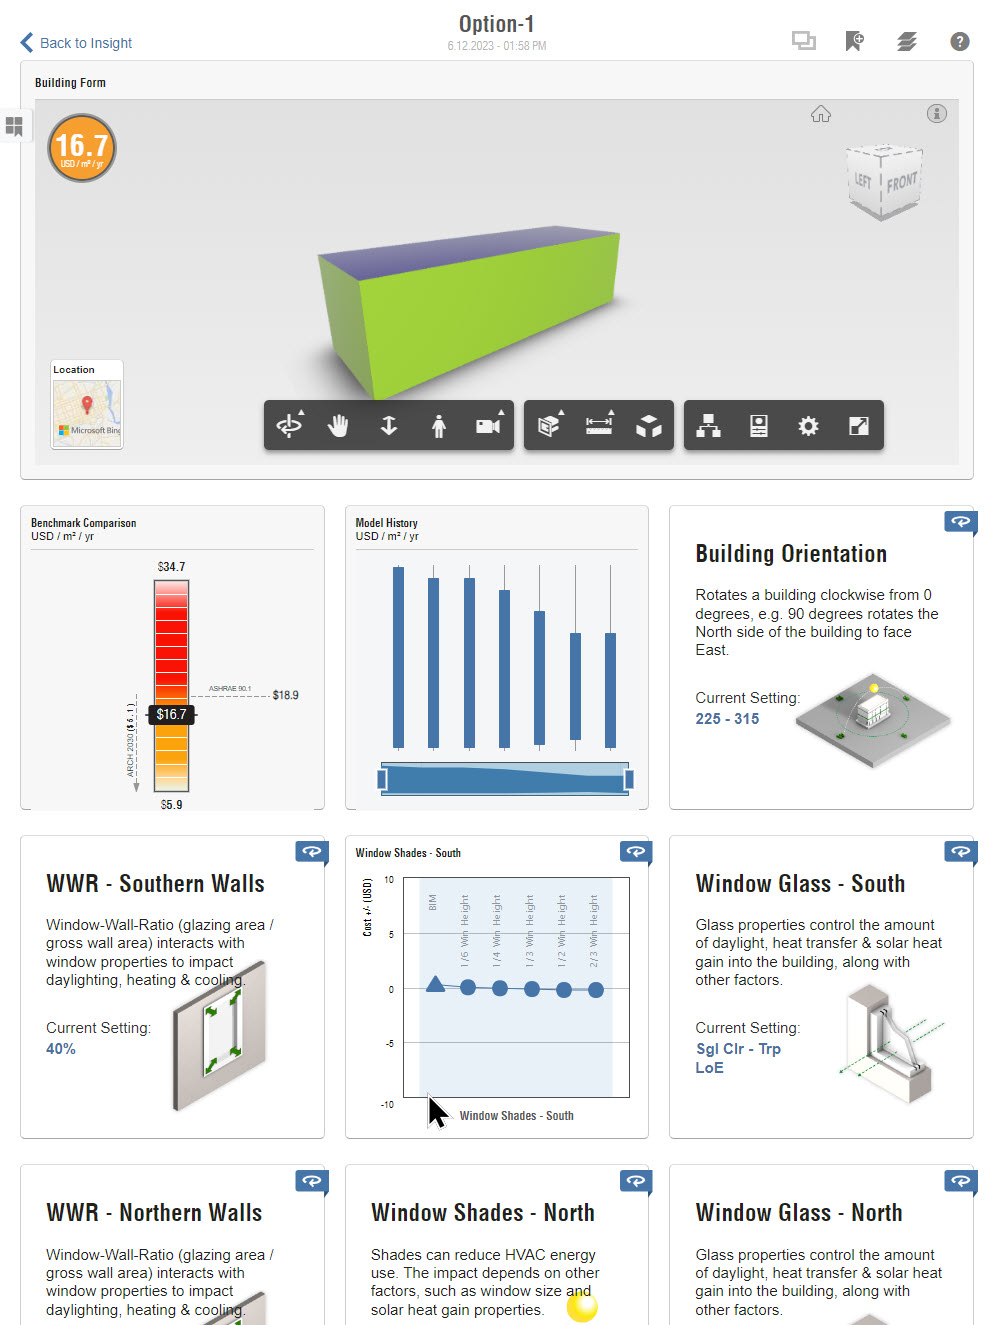
  14. Note the various panels:
    • The top panel displays the analytical model. It also contains a map showing the location that you can toggle to.
    • Below the top panel are a number of different panels, known as widgets, that are related to the key performance indicators of the model.
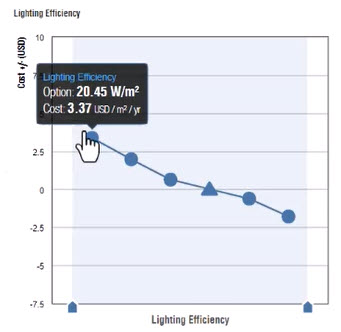
  15. Scroll down to the widget for Plug Load Efficiency and click on it. Adjust the performance criteria and see how it affects the energy cost.


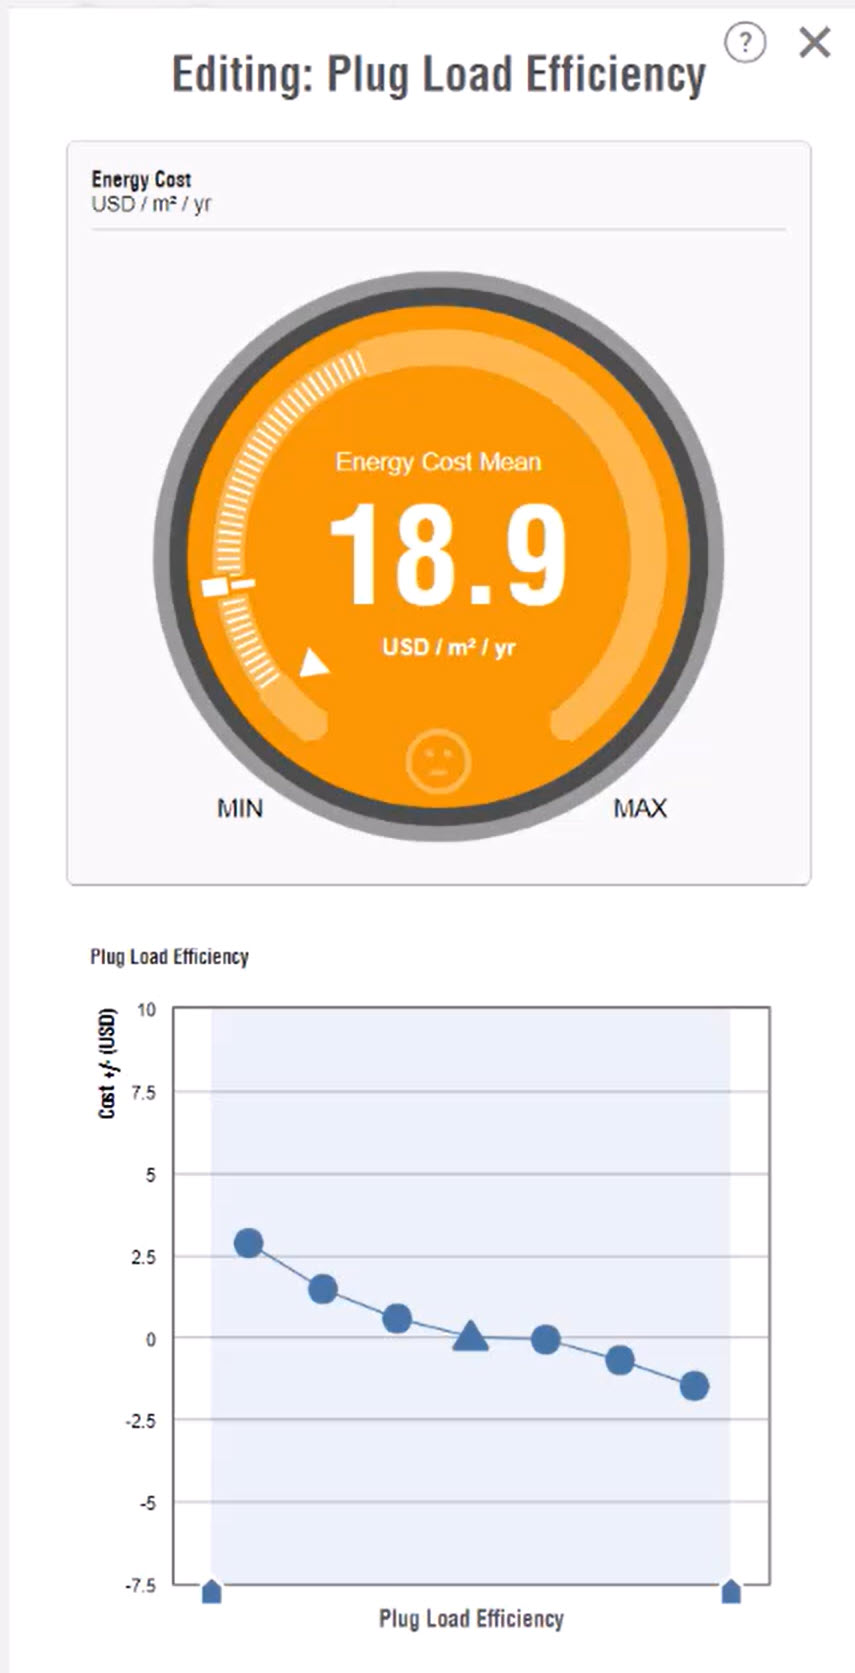
  16. Examine the various aspects indicated within other widgets. Feel free to experiment by moving the sliders at the bottom of the widgets to adjust the various settings to see how it will affect the performance.


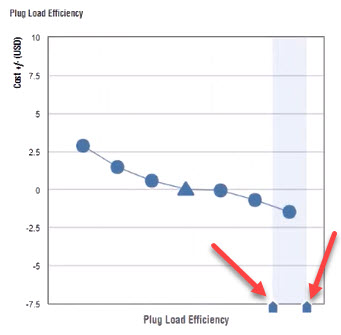
    • Also pay attention to the tooltips as you hover over the various dots that explain the gains or losses that can be achieved, as shown.


  17. Before exiting the Insight application, record the changes made for comparative analytical purposes by clicking on the Back to Insight text in the upper left corner.
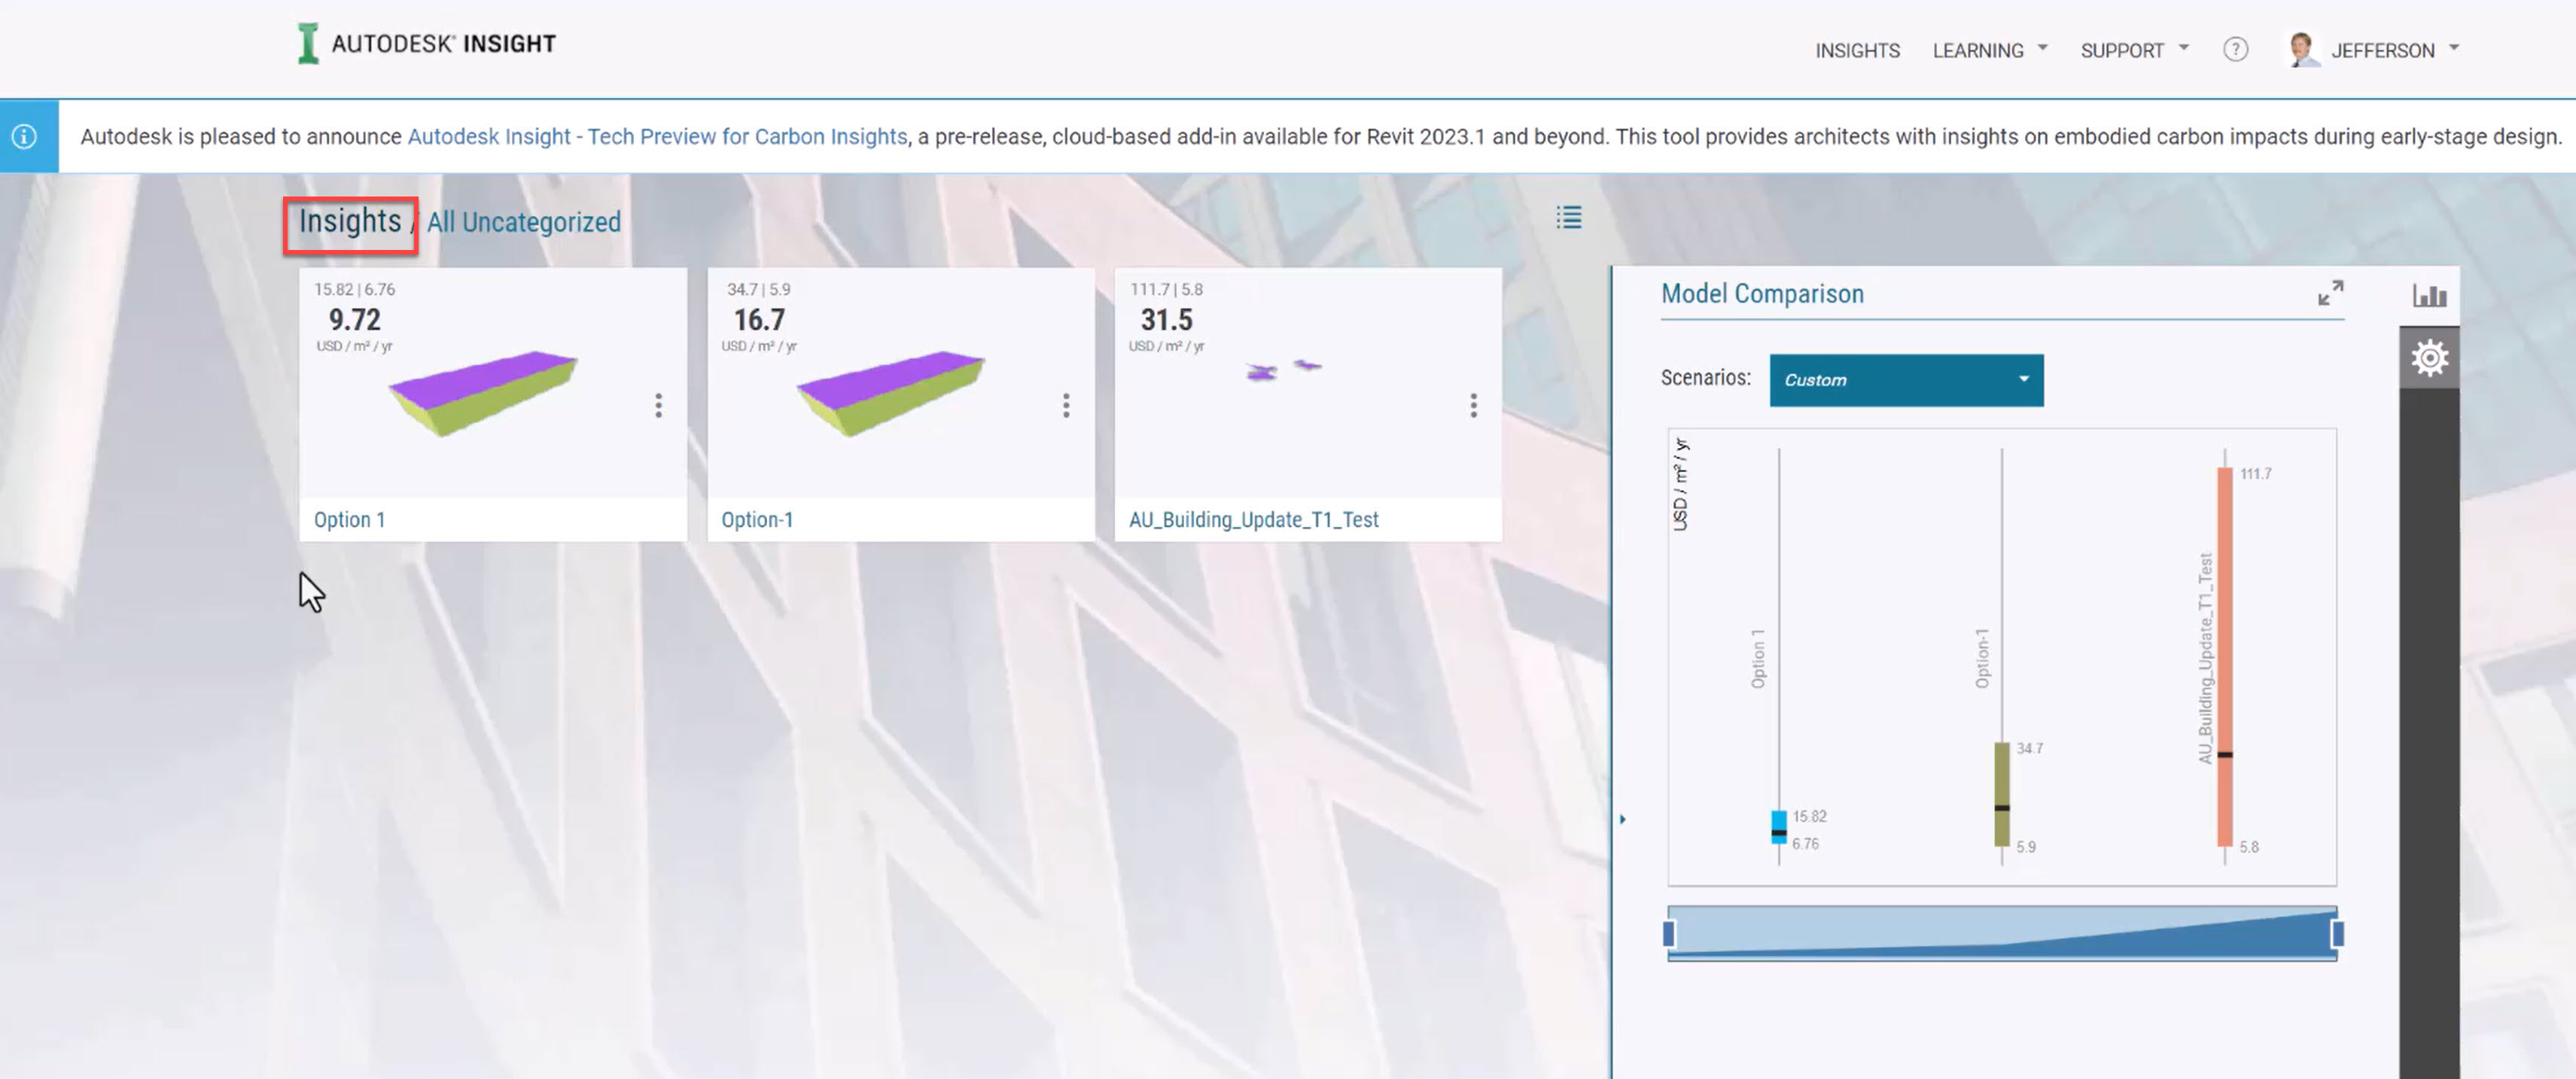
  18. Currently all are the models that were generated are uncategorized. To categorize them, go to the main Insight page by clicking on the Insights text in the upper left corner, as shown below.


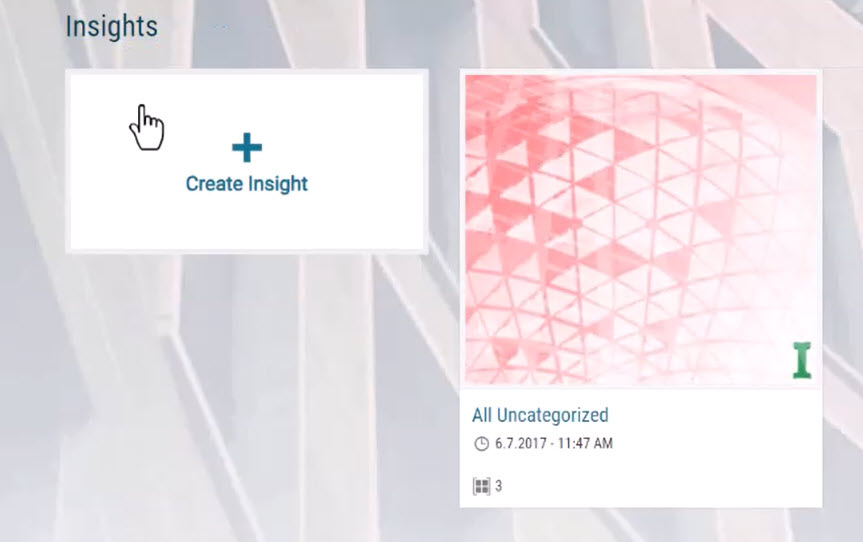
  19. To create an Insight, which is basically creating a folder, click on the Create Insight box, as shown below.


  20. A new folder is created, but it's untitled. Click on the ellipsis and select Rename to rename it, as shown below. Name it Headquarters.


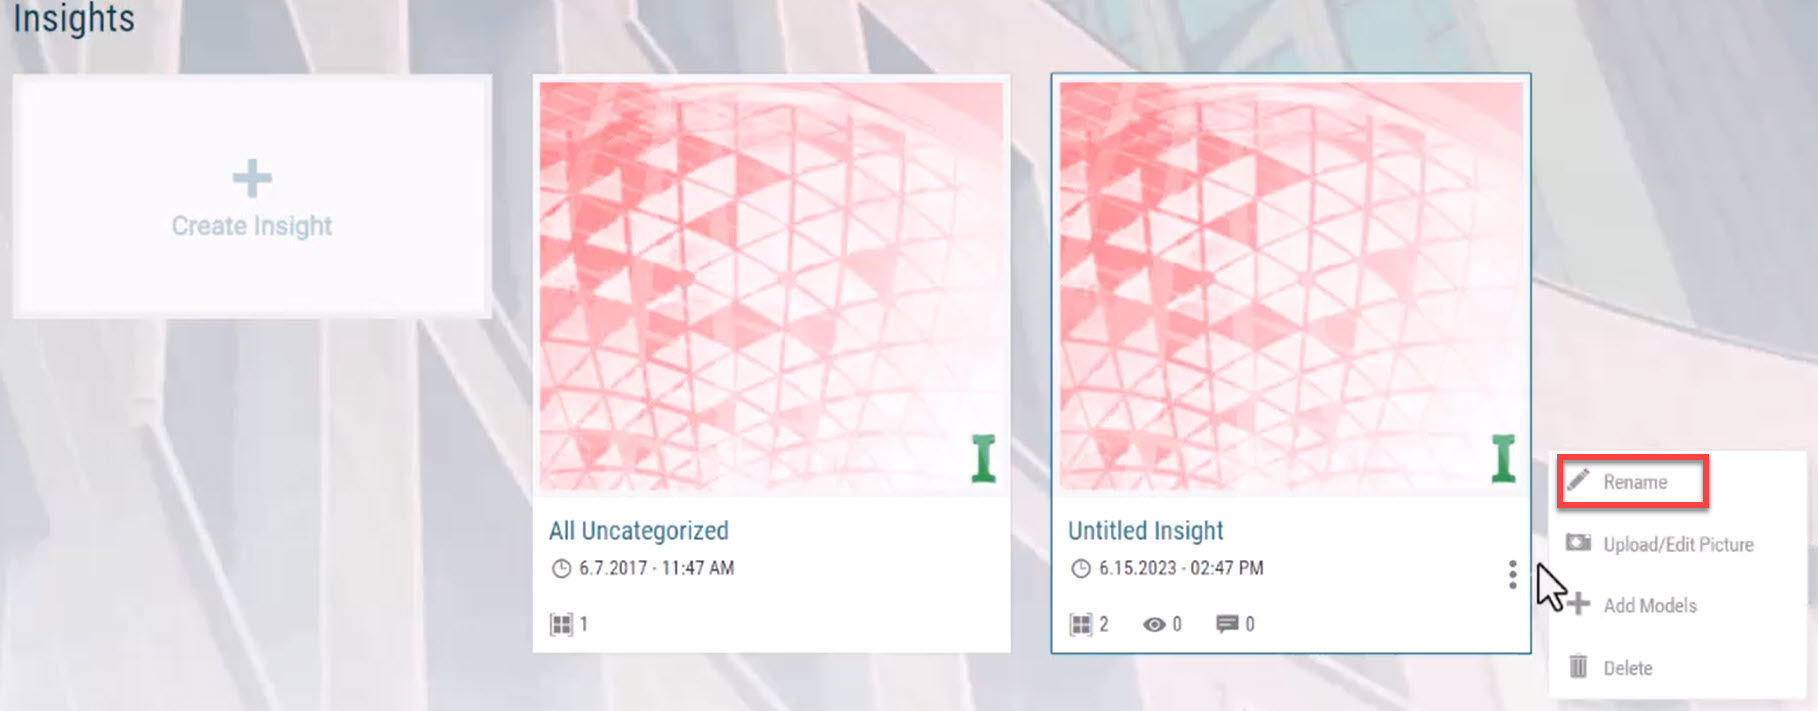
    • In the ellipsis menu, you can also add models and upload or edit a photo to make it more easily identifiable.
    • When more than one model is in an Insight, a comparison between them can be made.

Optional Task: Create an Insight Analysis for Option 2

  1. Open the Option 2 model that you completed in the previous unit's exercise.
  2. Review your energy settings and then generate an analysis in Insight.
  3. Once the analysis is complete, review your results in Insight.
  4. Go through each widget and change the performance criteria to see if you can reach the Architecture 2030 standard.
  5. Create a new Insight folder and add your analysis to that folder.
  6. As a bonus, go back to Revit, change your building shape, and create another Insight analysis. Add that to your Insight folder as well so you can compare the various options.
Was this information helpful?