Designing pipes for no flood criteria

00:03

for drainage designs to be valid. They first have to meet the no surcharge criteria

00:08

and then they must meet the no flood criteria.

00:12

In this example, the no surcharge criteria have already been designed

00:16

and the pipes have been sized adequately for no surcharge.

00:21

First

00:22

edit the rainfall data so that you are using a longer period storm

00:26

on the ribbon rainfall slash pollutants tab rainfall panel,

00:31

click rainfall manager to open the rainfall manager.

00:35

The design dot rainfall dot I D R X file is already active

00:41

in the tree view,

00:42

expand the design storms node and expand the F S R node and select rain one to edit it

00:49

The Rain one Parameters appear,

00:52

click the return periods tab.

00:55

Currently

00:56

there is a two year period set up,

00:59

click add to add another return period

01:02

Under return period years,

01:04

enter 30,

01:06

Then

01:07

enable the use option for the new 30-year storm and

01:10

then disable the two year storm to deactivate it.

01:14

Click the storm durations tab

01:16

here, leave all nine of these storms active,

01:20

return to the return periods tab to ensure the 30 year storm is active.

01:24

And then click the parameters tab here, leave both summer and winter active,

01:29

which multiplied by the nine active storms gives you an

01:37

click save and then exit the rainfall manager.

01:41

Keep in mind that the no flood criteria

01:43

are quite different from the no surcharge criteria.

01:47

The no flood considers a much longer period of time

01:50

as well as the extreme changes to the rainfall amounts,

01:53

whereas the no surcharge criteria took into account

01:56

a steady state or steady flow of runoff.

02:00

Now that the rainfall criteria have been set,

02:03

you can configure the analysis criteria

02:06

on the ribbon,

02:07

click the analysis tab and then in the criteria panel click analysis criteria.

02:13

The analysis criteria, dialog opens

02:17

here, you stipulate which storms you will run the analysis with.

02:21

In this case there is only one storm,

02:23

so click the checkbox next to rain one to select it

02:28

As soon as you do,

02:29

you can see the method number of storms and the maximum runtime values

02:35

appear as FS are the 18 storms 2880 minutes of runtime respectively.

02:43

Notice the output interval value set to one minute.

02:48

This indicates that the program is reporting a calculated result every minute.

02:54

It is actually performing the calculations every few seconds.

02:57

But for the purposes of the graphing and table tools, it is reported once per minute,

03:03

expand the time step drop down.

03:05

This affects how often the program performs the calculations,

03:09

you can set it to default

03:11

reduced or shortest.

03:15

Essentially this option helps you set the

03:17

balance for creating a stable hydrology model

03:20

in which you can trust the calculations are correct

03:24

info drainage uses S W M M

03:26

a very well understood

03:28

stable calculation model.

03:31

If you were to set this to shortest,

03:33

it would take longer for the calculations to complete.

03:37

In addition,

03:38

it is best to use when you have a more complicated system

03:41

that has storage areas or any constrictions to the flow.

03:44

But since this model is just one line of pipes running downhill,

03:48

you can keep the time step set to default.

03:53

The next parameter urban creep is used to take into

03:56

account that over time the pimp value will increase.

04:00

Property owners may install additional structures or

04:03

they may add a paved parking area,

04:05

all of which would increase the percentage impervious value.

04:10

This can be set to use a global value or

04:13

it can be added to each subcategory within the model

04:17

For this exercise.

04:18

Leave it set to apply global value and leave the percentage set to zero

04:24

the junction flood risk margin is whether the water has come within a certain

04:27

distance of the cover levels in times that it has flooded or nearly flooded.

04:32

This is set to 300

04:35

by default, but you can change this if you need to

04:39

leave the perform no discharge analysis option d selected

04:42

as it is not a normal part of the no flood criteria

04:46

and will not be needed for this exercise.

04:49

Click ok

04:51

with the design criteria set.

04:53

It is time to validate the calculation model

04:57

on the ribbon analysis tab analysis panel, click validate

05:03

the validate. Dialogue opens showing that the site is okay

05:08

if there were any errors such as a pipe that did not have a

05:11

length specified or a manhole that did not have a cover level specified.

05:15

They would appear here under the site node.

05:19

You would be able to click on them to see where in the model the error was

05:23

and the relevant dialog box would open

05:25

so that you could fix the error.

05:28

This is a simple model, however, so no errors occurred.

05:32

Keep in mind that this validation tool checks to

05:35

make sure all the necessary data is there,

05:38

It does not check to make sure the data makes sense.

05:41

For example, if you had an oversized or undersized pipe,

05:45

it would not recognize that here,

05:47

but if those values were completely missing, it would list the error,

05:51

click cancel.

Video transcript

00:03

for drainage designs to be valid. They first have to meet the no surcharge criteria

00:08

and then they must meet the no flood criteria.

00:12

In this example, the no surcharge criteria have already been designed

00:16

and the pipes have been sized adequately for no surcharge.

00:21

First

00:22

edit the rainfall data so that you are using a longer period storm

00:26

on the ribbon rainfall slash pollutants tab rainfall panel,

00:31

click rainfall manager to open the rainfall manager.

00:35

The design dot rainfall dot I D R X file is already active

00:41

in the tree view,

00:42

expand the design storms node and expand the F S R node and select rain one to edit it

00:49

The Rain one Parameters appear,

00:52

click the return periods tab.

00:55

Currently

00:56

there is a two year period set up,

00:59

click add to add another return period

01:02

Under return period years,

01:04

enter 30,

01:06

Then

01:07

enable the use option for the new 30-year storm and

01:10

then disable the two year storm to deactivate it.

01:14

Click the storm durations tab

01:16

here, leave all nine of these storms active,

01:20

return to the return periods tab to ensure the 30 year storm is active.

01:24

And then click the parameters tab here, leave both summer and winter active,

01:29

which multiplied by the nine active storms gives you an

01:37

click save and then exit the rainfall manager.

01:41

Keep in mind that the no flood criteria

01:43

are quite different from the no surcharge criteria.

01:47

The no flood considers a much longer period of time

01:50

as well as the extreme changes to the rainfall amounts,

01:53

whereas the no surcharge criteria took into account

01:56

a steady state or steady flow of runoff.

02:00

Now that the rainfall criteria have been set,

02:03

you can configure the analysis criteria

02:06

on the ribbon,

02:07

click the analysis tab and then in the criteria panel click analysis criteria.

02:13

The analysis criteria, dialog opens

02:17

here, you stipulate which storms you will run the analysis with.

02:21

In this case there is only one storm,

02:23

so click the checkbox next to rain one to select it

02:28

As soon as you do,

02:29

you can see the method number of storms and the maximum runtime values

02:35

appear as FS are the 18 storms 2880 minutes of runtime respectively.

02:43

Notice the output interval value set to one minute.

02:48

This indicates that the program is reporting a calculated result every minute.

02:54

It is actually performing the calculations every few seconds.

02:57

But for the purposes of the graphing and table tools, it is reported once per minute,

03:03

expand the time step drop down.

03:05

This affects how often the program performs the calculations,

03:09

you can set it to default

03:11

reduced or shortest.

03:15

Essentially this option helps you set the

03:17

balance for creating a stable hydrology model

03:20

in which you can trust the calculations are correct

03:24

info drainage uses S W M M

03:26

a very well understood

03:28

stable calculation model.

03:31

If you were to set this to shortest,

03:33

it would take longer for the calculations to complete.

03:37

In addition,

03:38

it is best to use when you have a more complicated system

03:41

that has storage areas or any constrictions to the flow.

03:44

But since this model is just one line of pipes running downhill,

03:48

you can keep the time step set to default.

03:53

The next parameter urban creep is used to take into

03:56

account that over time the pimp value will increase.

04:00

Property owners may install additional structures or

04:03

they may add a paved parking area,

04:05

all of which would increase the percentage impervious value.

04:10

This can be set to use a global value or

04:13

it can be added to each subcategory within the model

04:17

For this exercise.

04:18

Leave it set to apply global value and leave the percentage set to zero

04:24

the junction flood risk margin is whether the water has come within a certain

04:27

distance of the cover levels in times that it has flooded or nearly flooded.

04:32

This is set to 300

04:35

by default, but you can change this if you need to

04:39

leave the perform no discharge analysis option d selected

04:42

as it is not a normal part of the no flood criteria

04:46

and will not be needed for this exercise.

04:49

Click ok

04:51

with the design criteria set.

04:53

It is time to validate the calculation model

04:57

on the ribbon analysis tab analysis panel, click validate

05:03

the validate. Dialogue opens showing that the site is okay

05:08

if there were any errors such as a pipe that did not have a

05:11

length specified or a manhole that did not have a cover level specified.

05:15

They would appear here under the site node.

05:19

You would be able to click on them to see where in the model the error was

05:23

and the relevant dialog box would open

05:25

so that you could fix the error.

05:28

This is a simple model, however, so no errors occurred.

05:32

Keep in mind that this validation tool checks to

05:35

make sure all the necessary data is there,

05:38

It does not check to make sure the data makes sense.

05:41

For example, if you had an oversized or undersized pipe,

05:45

it would not recognize that here,

05:47

but if those values were completely missing, it would list the error,

05:51

click cancel.

Video quiz

When configuring the options for no-flood criteria in the Rainfall Manager, which two options combined make up the storm sample size for the runoff analysis?

(Select one)
Select an answer

1/1 questions left unanswered

Step-by-step:

For drainage designs to be valid in the UK, they first have to meet the no-surcharge criteria, and then they must meet the no-flood criteria. In this example, the no-surcharge criteria have already been met, so now, it is necessary to check the no flood criteria.

  1. On the ribbon, Rainfall/Pollutants tab, click Rainfall Manager.
  2. In the Rainfall Manager Items tree view, expand the Design Storms node, then the FSR node, and select Rain 1 to edit it.
  3. Click the Return Periods tab.
  4. Click Add to add another return period.
  5. Click Add to add another return period.
  6. Enable the Use option for the new 30-year storm, and disable the 2-year storm to deactivate it.
    The Rainfall Manager, with the Rain1 rainfall activated. The Return Periods tab is showing, and the Use column is highlighted for changes.
  7. Click the Storm Durations tab.
  8. Leave all nine of these storms active.
    The Rainfall Manager, with the Storm Durations tab active. Under the Use column in the table of rainfall events, nine of the storm durations are checked off as being active.
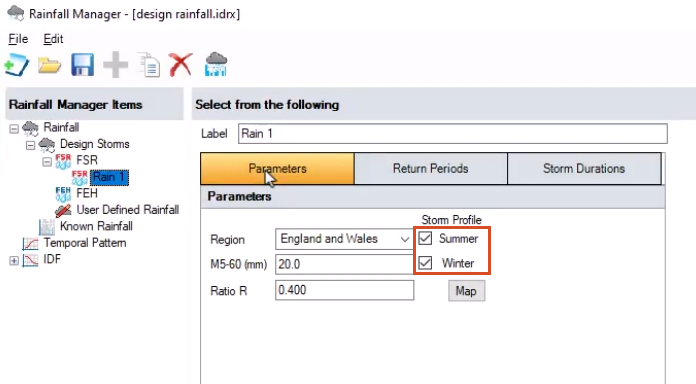
  9. Click the Parameters tab.
  10. Enable both Summer and Winter.
    The Rainfall Manager, with the Parameters tab showing and the Storm Profiles checked for both Summer and Winter.
  11. In the Rainfall Manager toolbar, click Save.
    The Rainfall Manager, with a callout to the Save icon in the toolbar.
  12. Click Close.
  13. On the ribbon, Analysis tab, Criteria panel, click Analysis Criteria.
  14. In the Analysis Criteria dialog box, enable Rain 1.
  15. Set the Output Interval to 1
  16. Expand the Time Step drop-down and select Default.
  17. Set Urban Creep to Apply Global Value and leave the percentage set to 0.
  18. Set the Junction Flood Risk Margin to 300
  19. Deselect Perform No Discharge Analysis.
  20. Click OK.
    The Analysis Criteria dialog box, with all applicable options configured. The user is about to click OK.
  21. On the ribbon, Analysis tab, Analysis panel, click Validate.
  22. In the Validate dialog box, ensure the validation is okay.
    The InfoDrainage interface and Validate dialog box in the background, with a callout message showing in the foreground that reminds users what is validated and what is not during that process.
  23. Click OK.
  24. Save the file.
Was this information helpful?