Step-by-step Guide
In InfoWorks WS Pro, themes are useful to see how a group of objects is behaving by color-coding them. For example, if you perform a rezone in a network, themes allow you to see how water pressure changes.
- Open the Session 04 Base scenario in the GeoPlan.
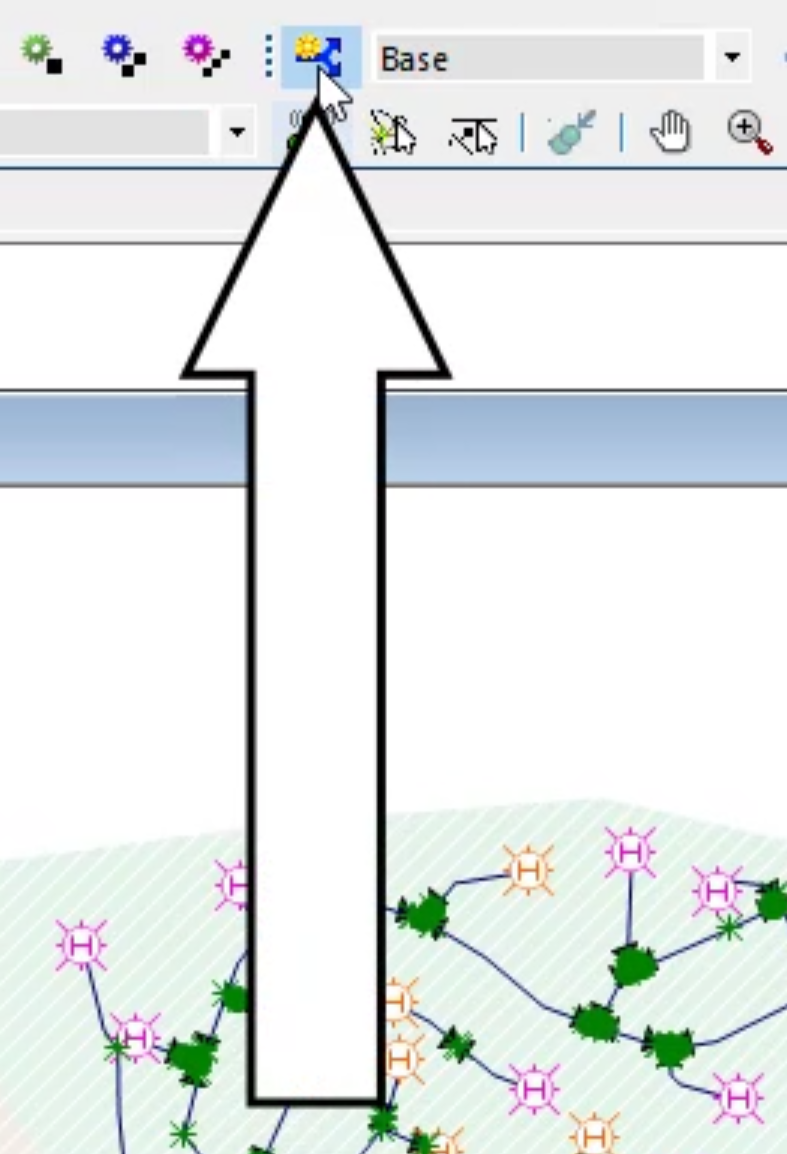
- In the Scenarios toolbar, click Create new scenario.
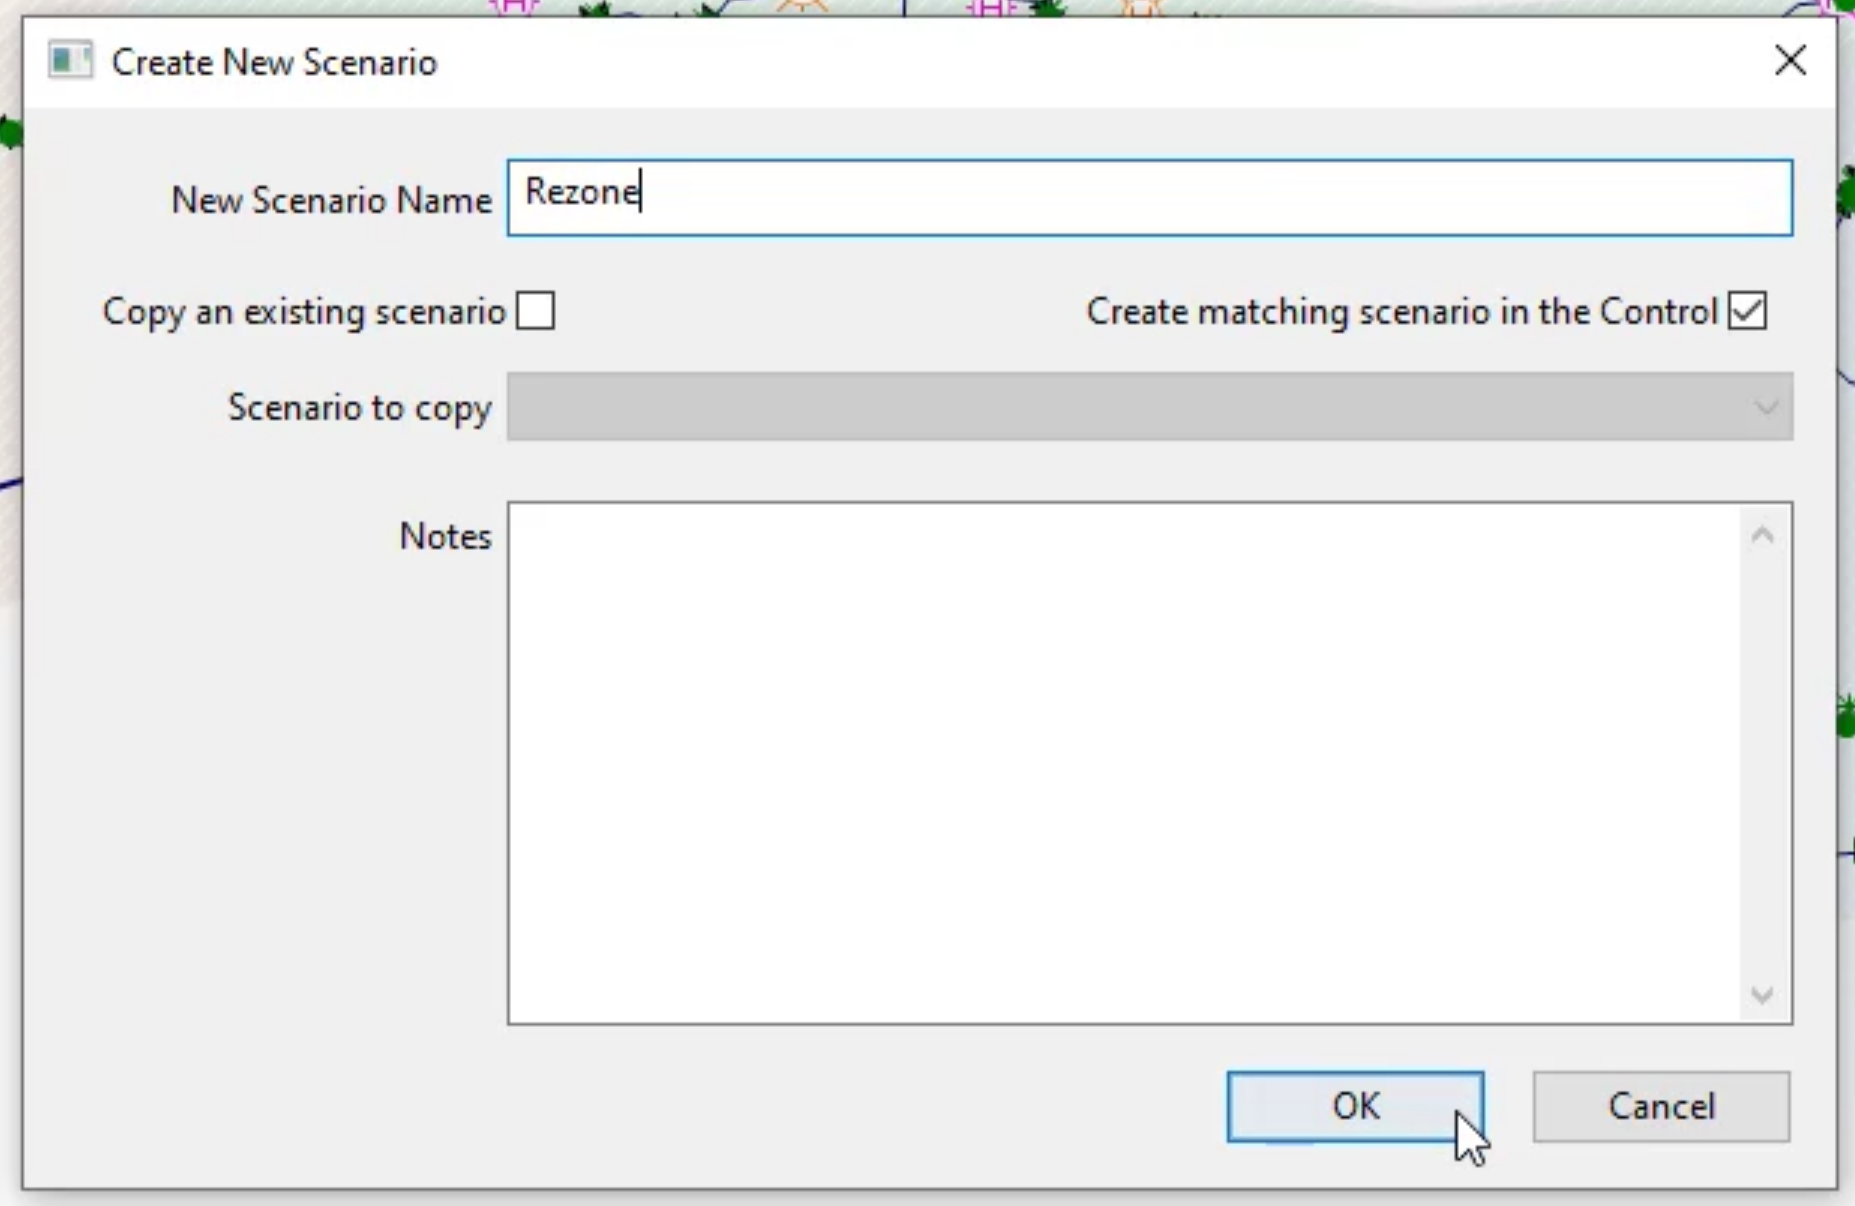
- In the Create New Scenario dialog box, enter the name “Rezone”.
- Click OK.
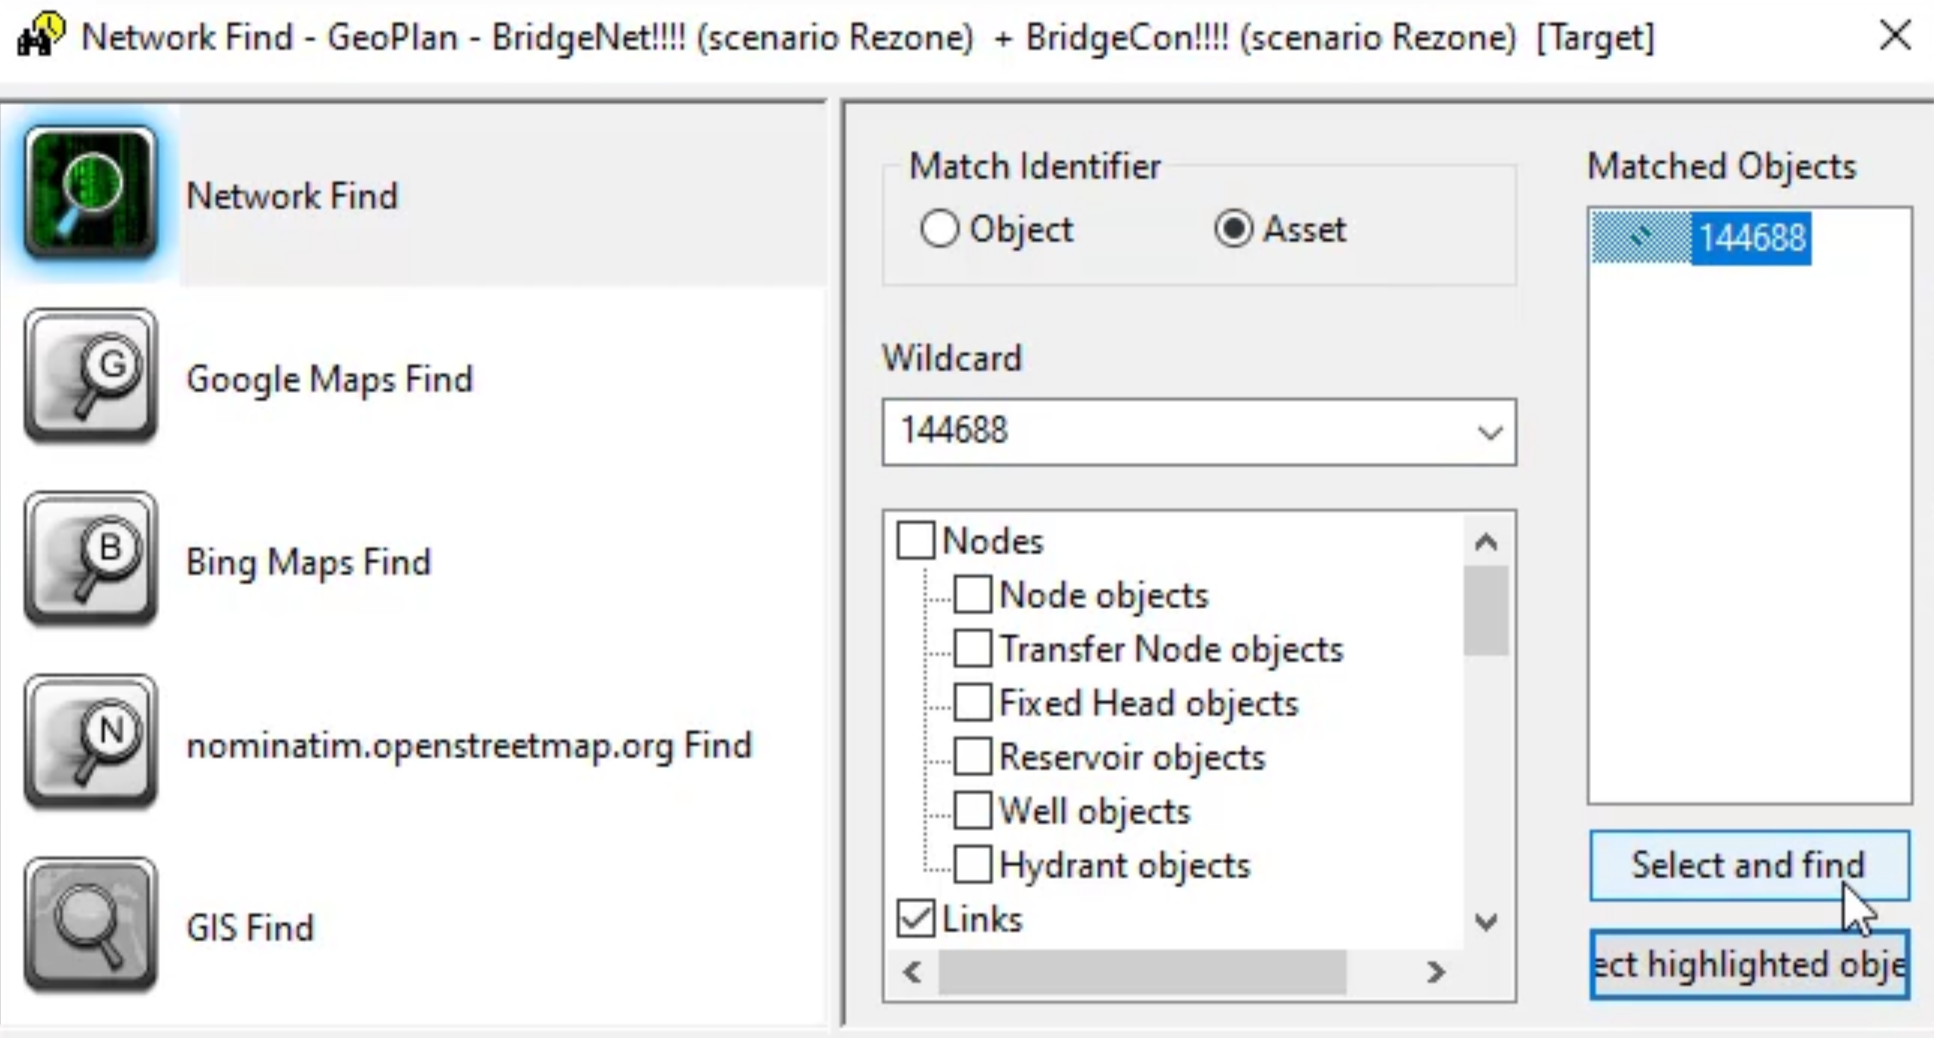
- Use the Find Network Objects command to locate the pipe with the asset ID 144688.
To close the pipe, simulating a burst or similar problem:
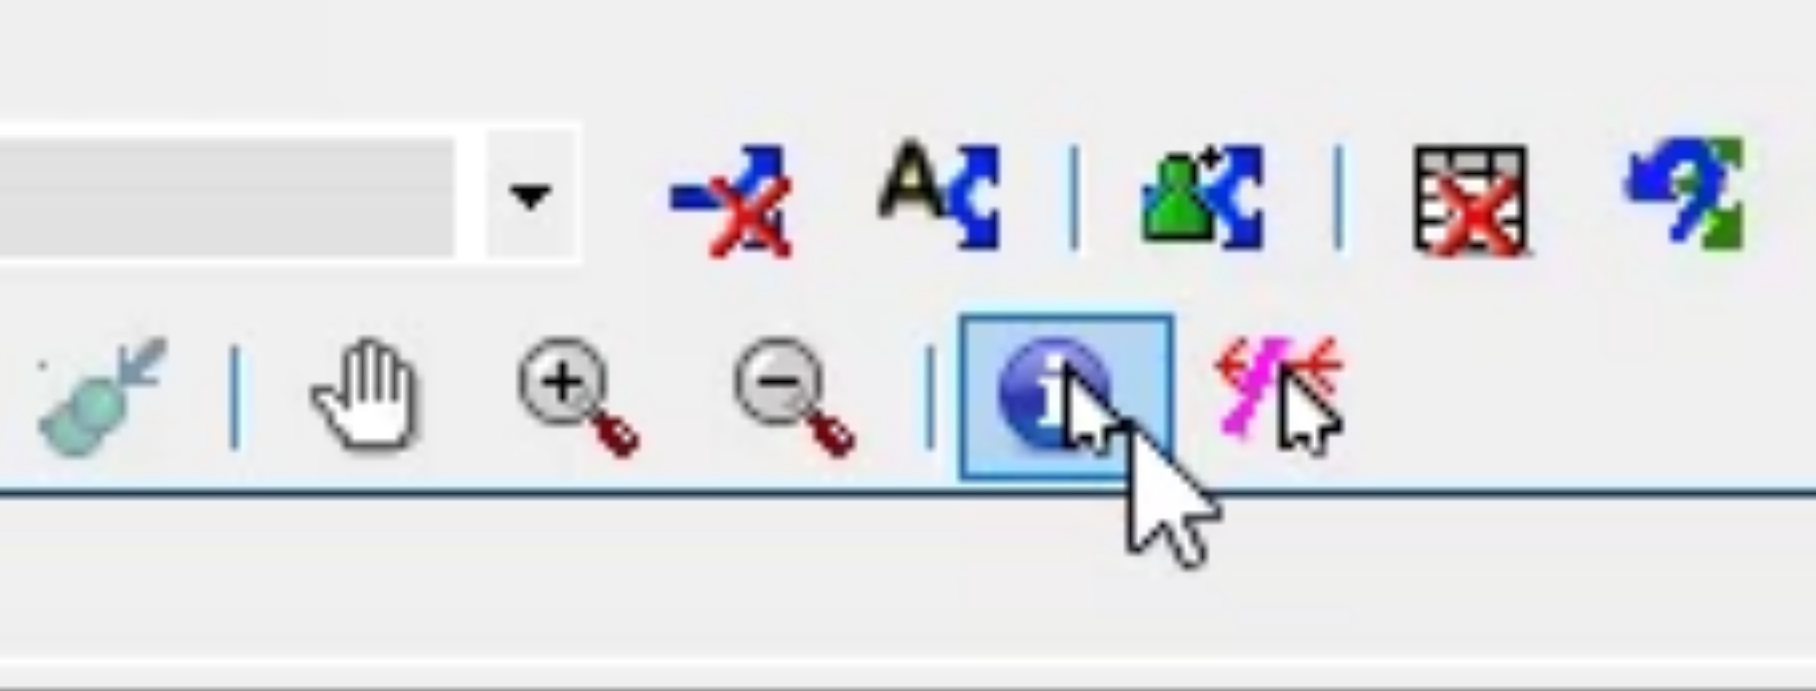
- In the Tools toolbar, select Properties.
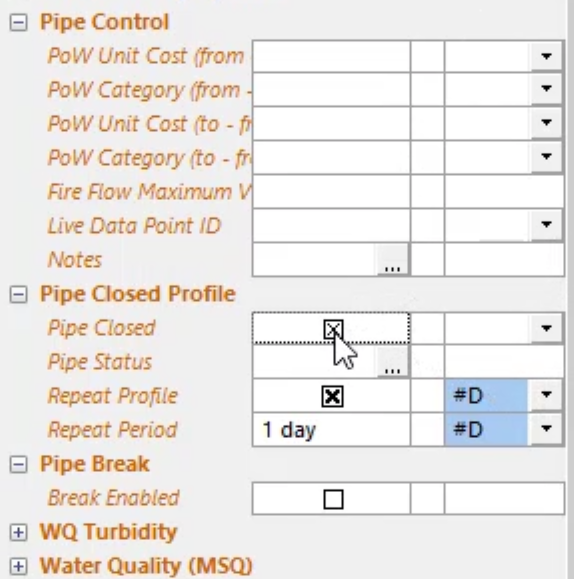
- In the Properties window, under Pipe Closed Profile, enable Pipe Closed.
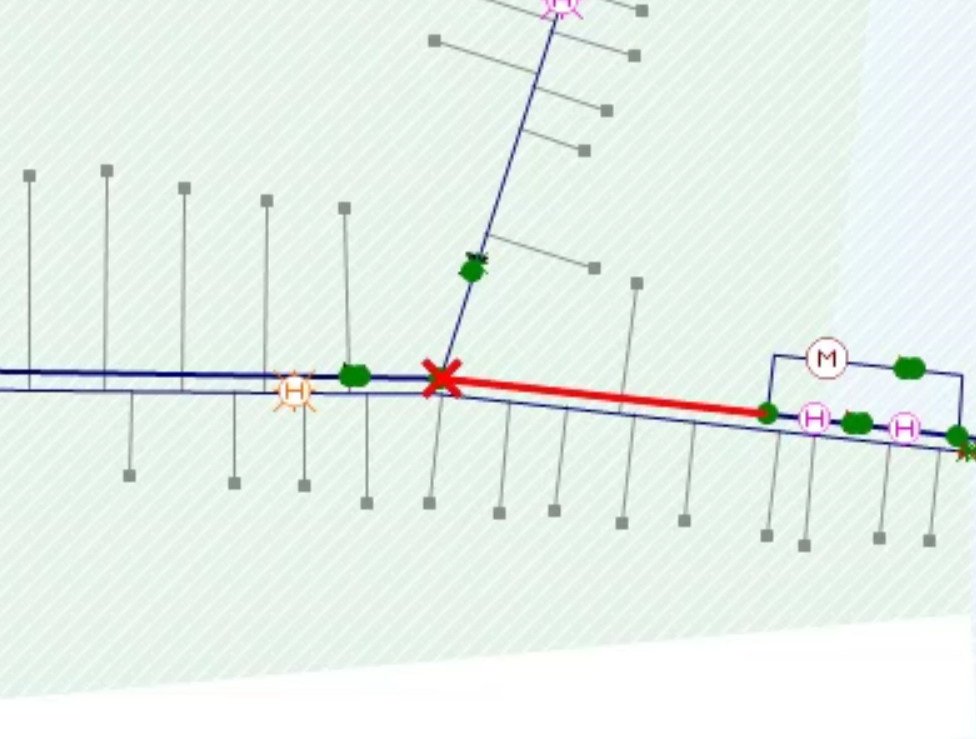
Note in the GeoPlan, a red “X” appears on the pipe.
- Find the valve with the asset ID 234298.
- Select Properties.
- In the Properties window, under Valve Control, set the Opening (%) to “100”.
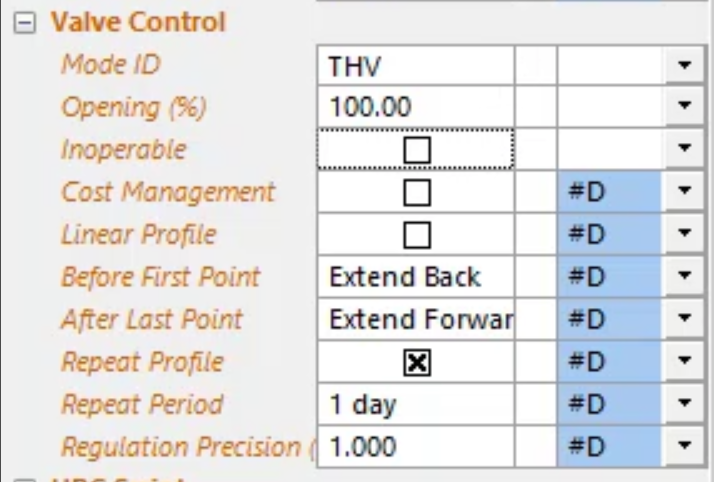
Note: In this situation, you might open the valve to reroute water around the damaged pipe to avoid interruption to the supply.
- Commit the changes to both the network and the control.
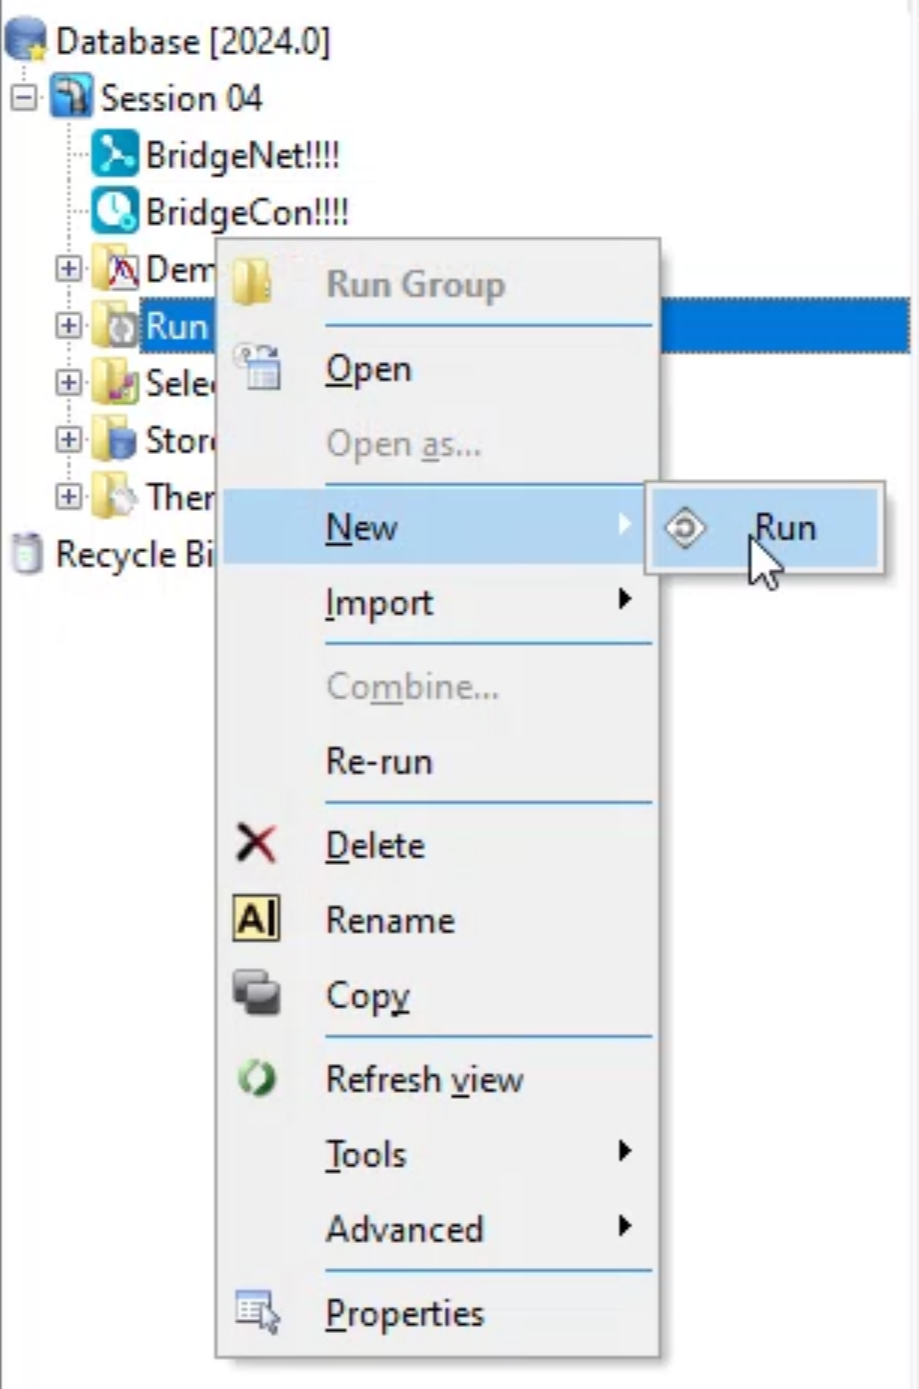
- From the Model Group window, right-click Run Group and select New > Run.
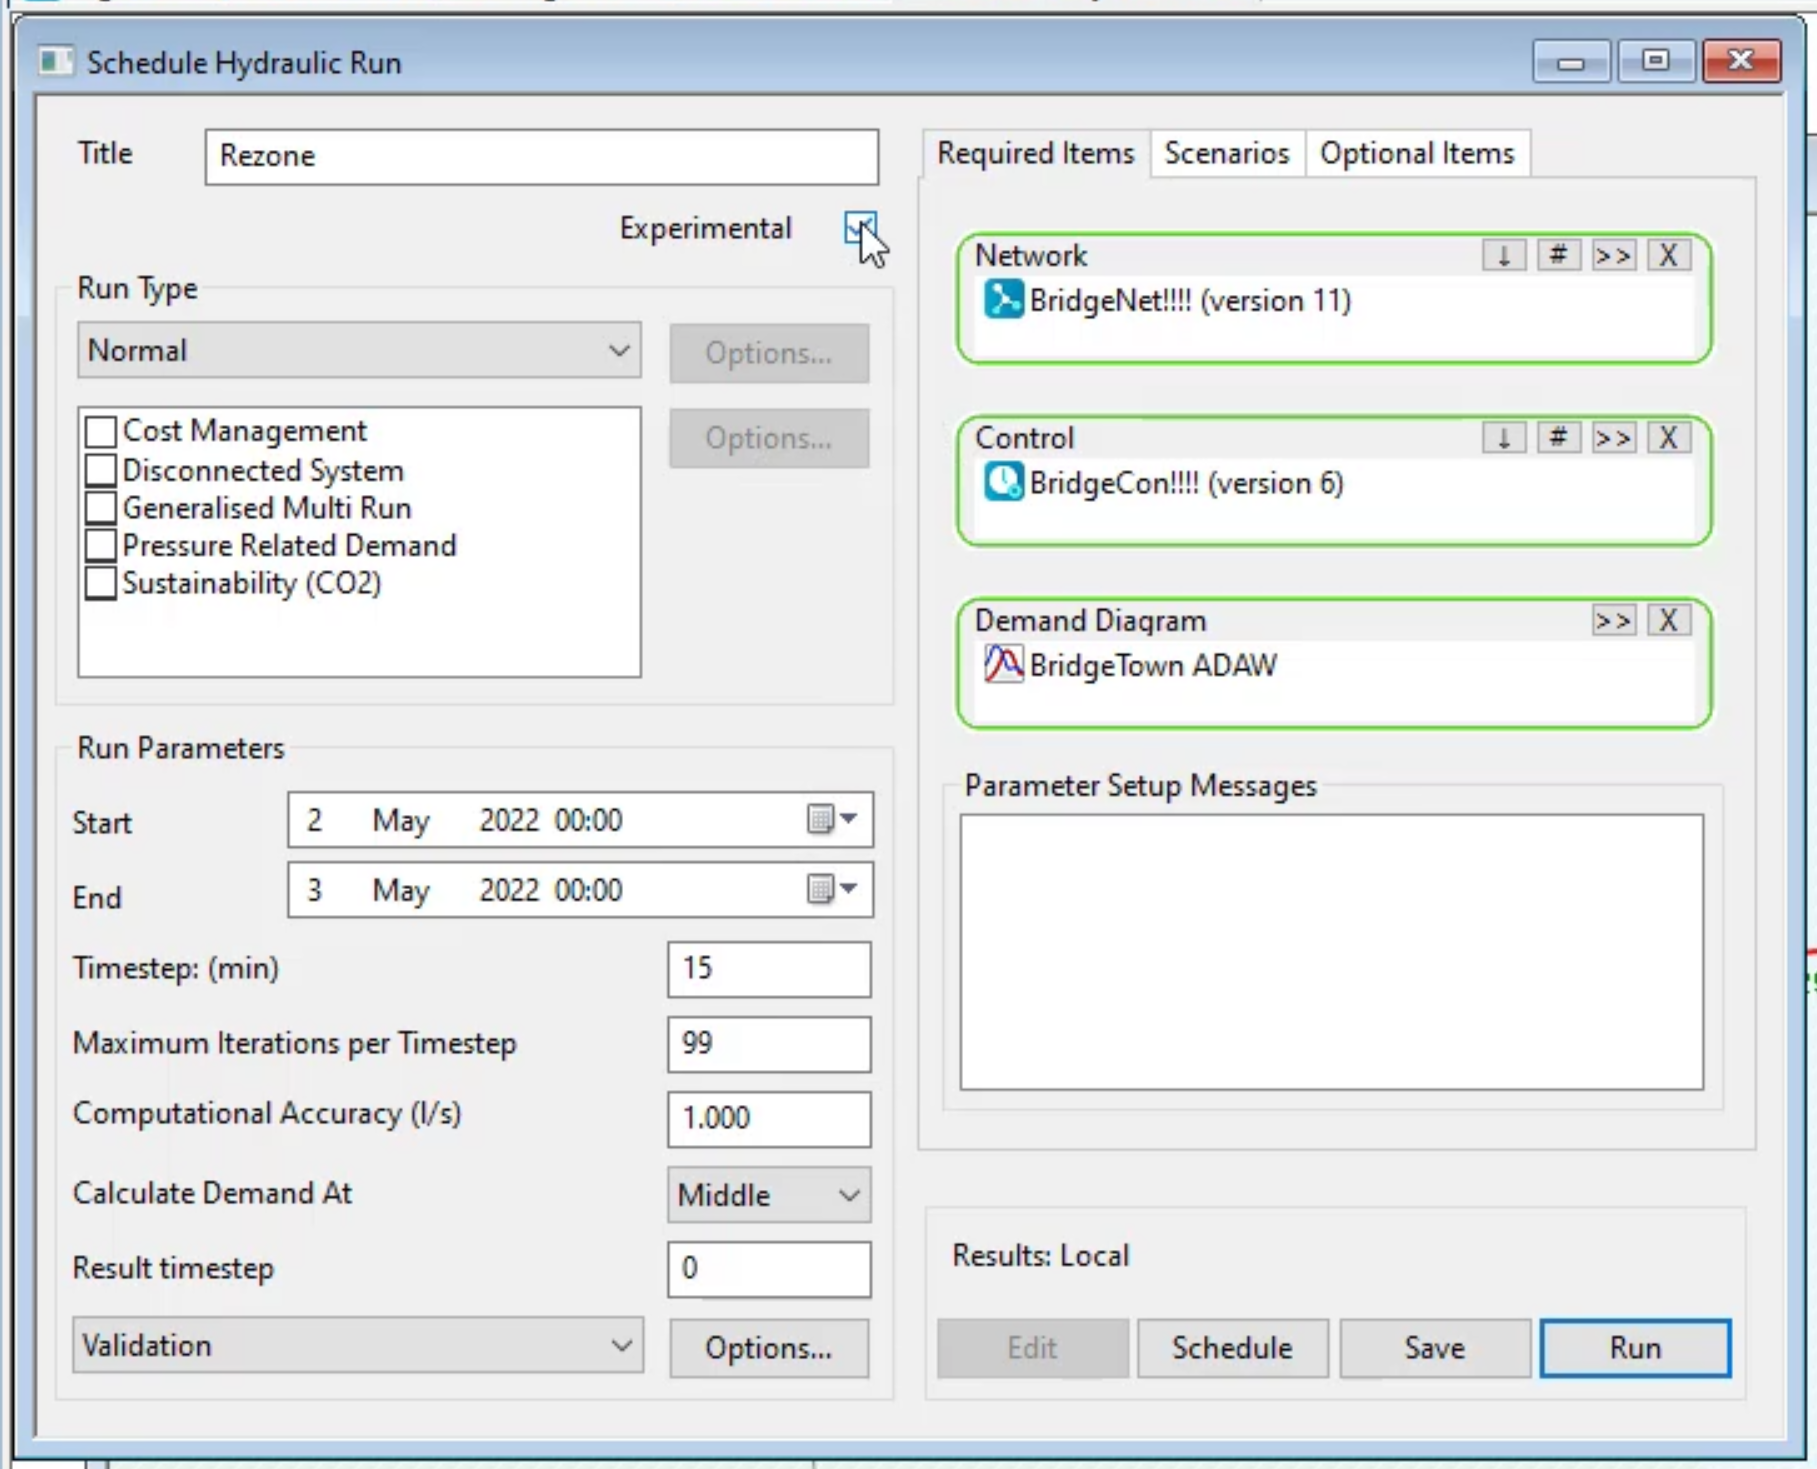
- In the Schedule Hydraulic Run dialog box, title the run “Rezone”.
- Drag-and-drop the BridgeNet network into the Network group box.
- Enable Experimental.
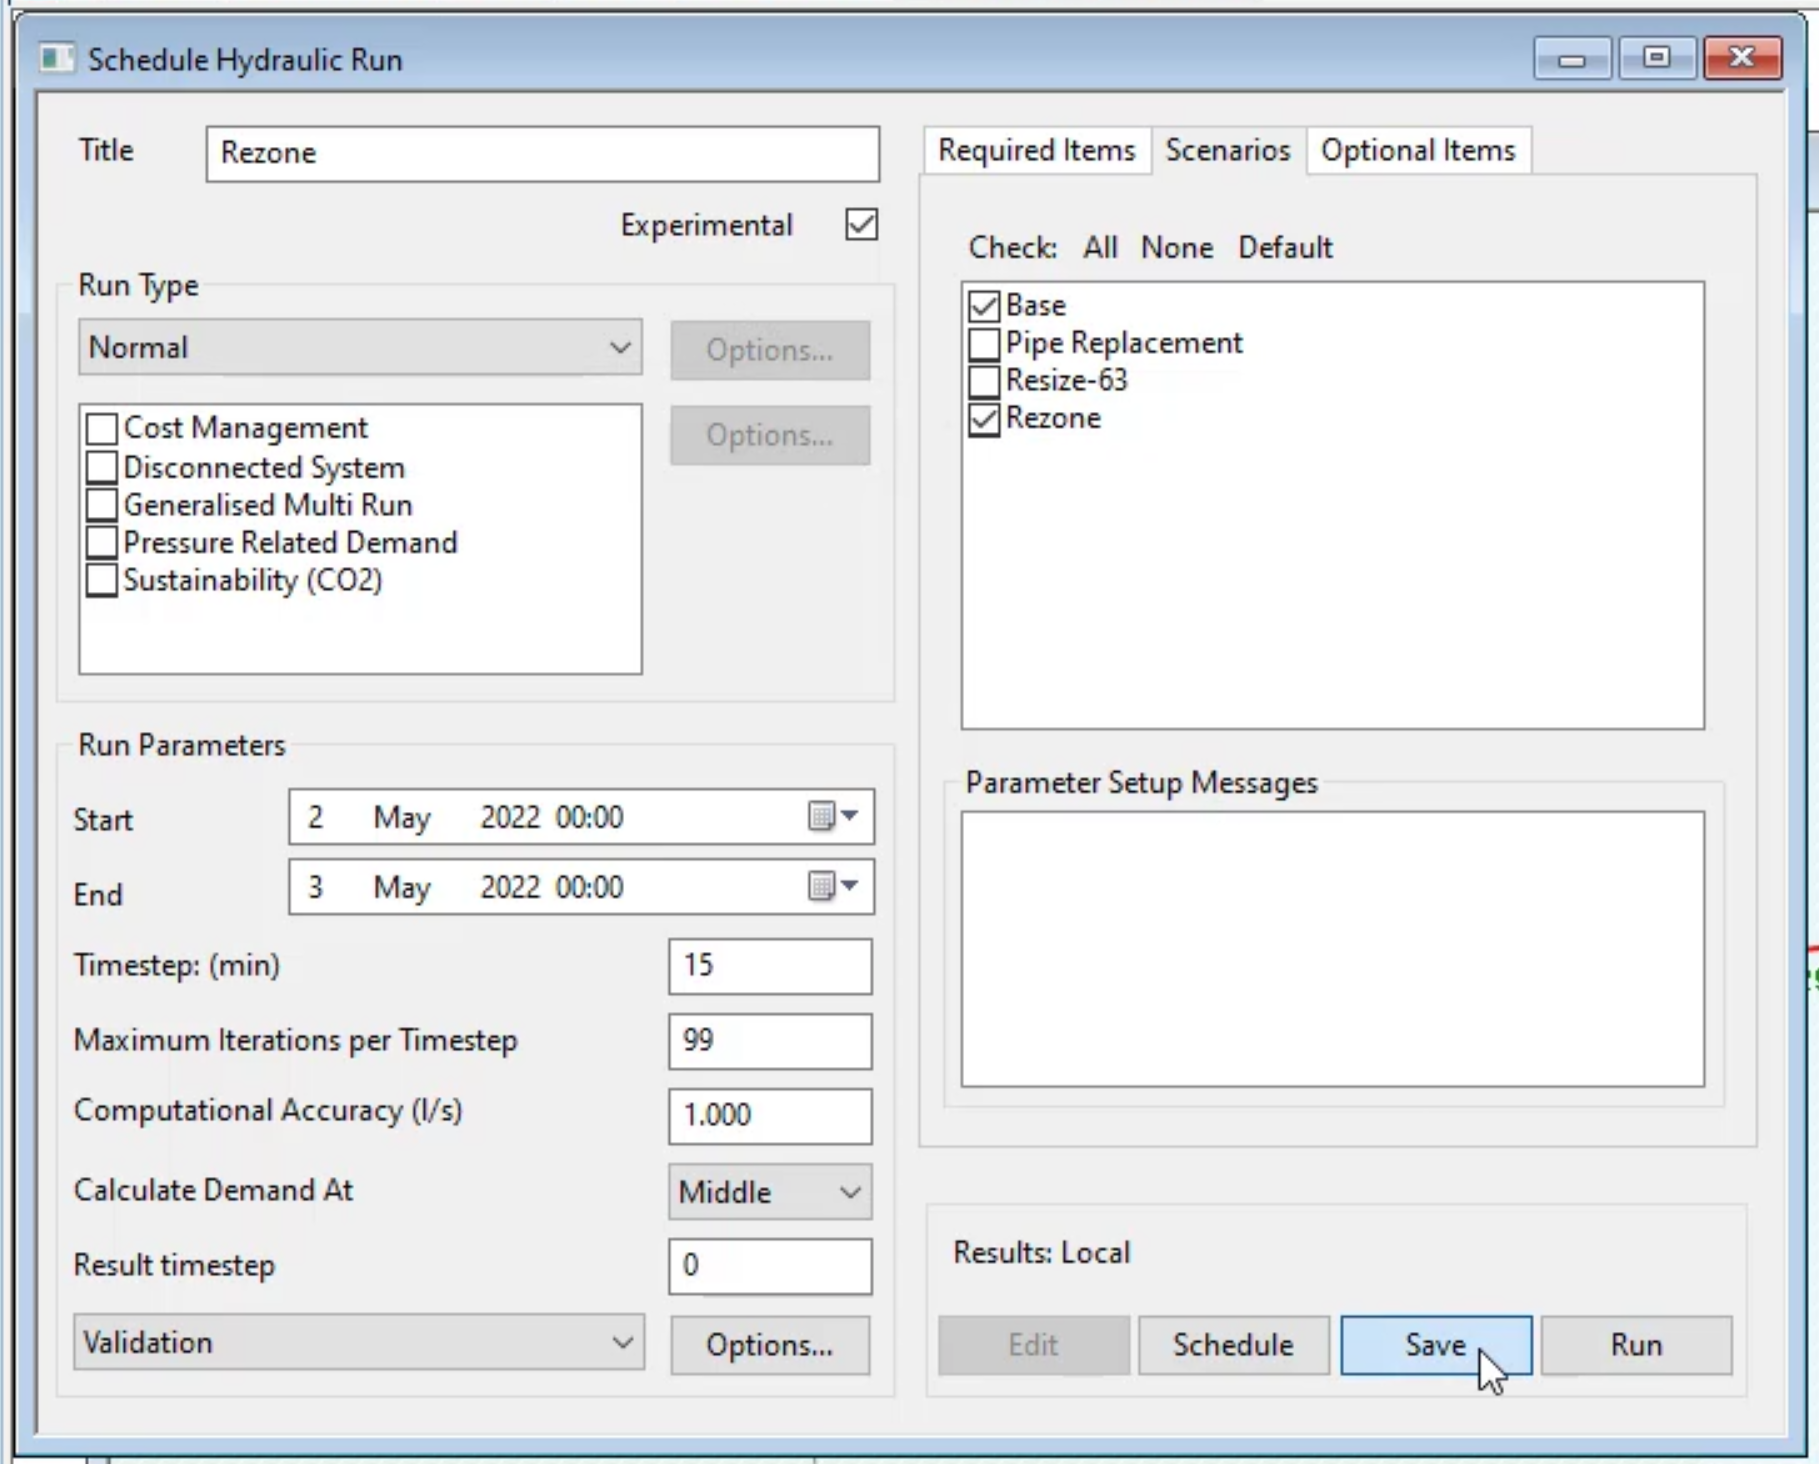
- In the Scenarios tab, enable Base.
- Enable Rezone.
- Click Save.
- Click Run.
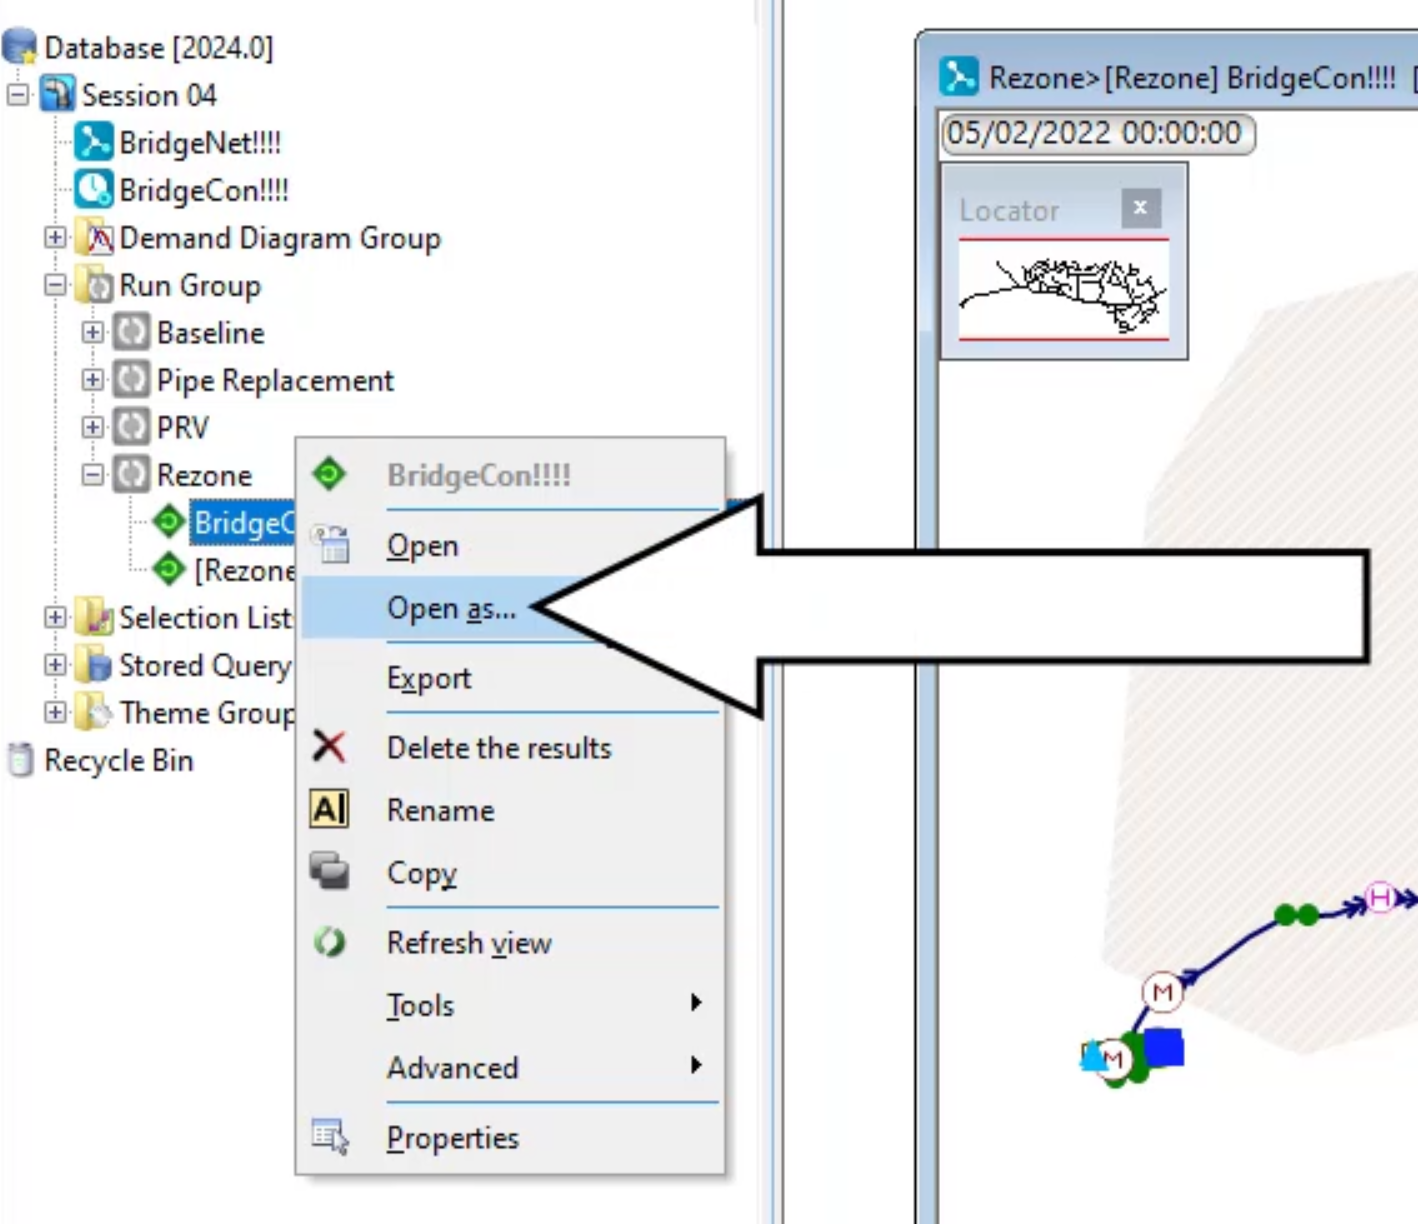
- In the Model Group window, expand Rezone. Drag-and-drop [Rezone] BridgeCon into the workspace.
- Right-click BridgeCon and select Open as.
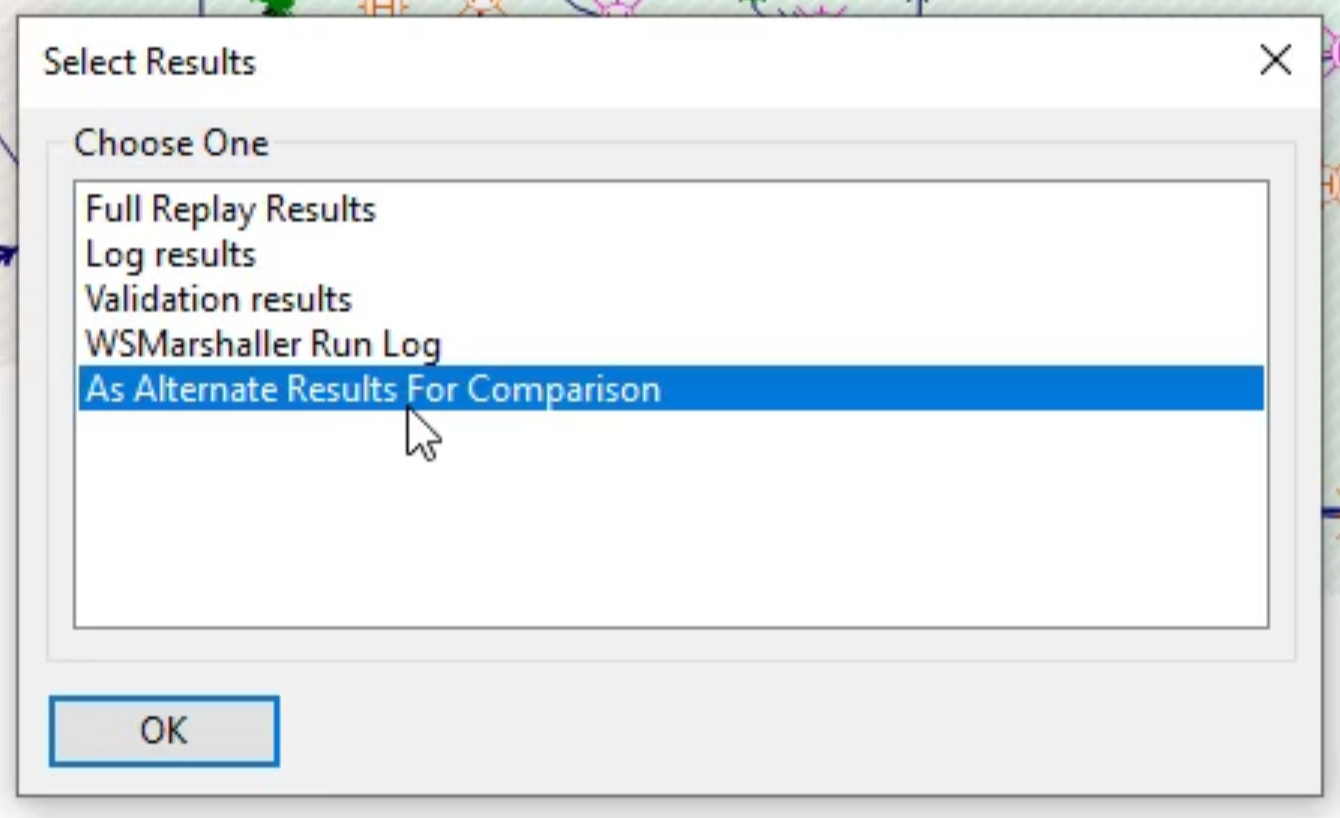
- In the Select Results dialog box, click As Alternate Results For Comparison.
- Click OK.
To apply a predefined theme to the model:
- In the Model Group window, expand Theme Group.
- Expand Factory (add).
- Drag-and-drop the Nodal Pressure theme into the run GeoPlan.
Notice the nodes are color-coded to reflect changes in water pressure across the network.

- Click through the timeline bar in the top-left corner of the GeoPlan to see how pressure changes over time.
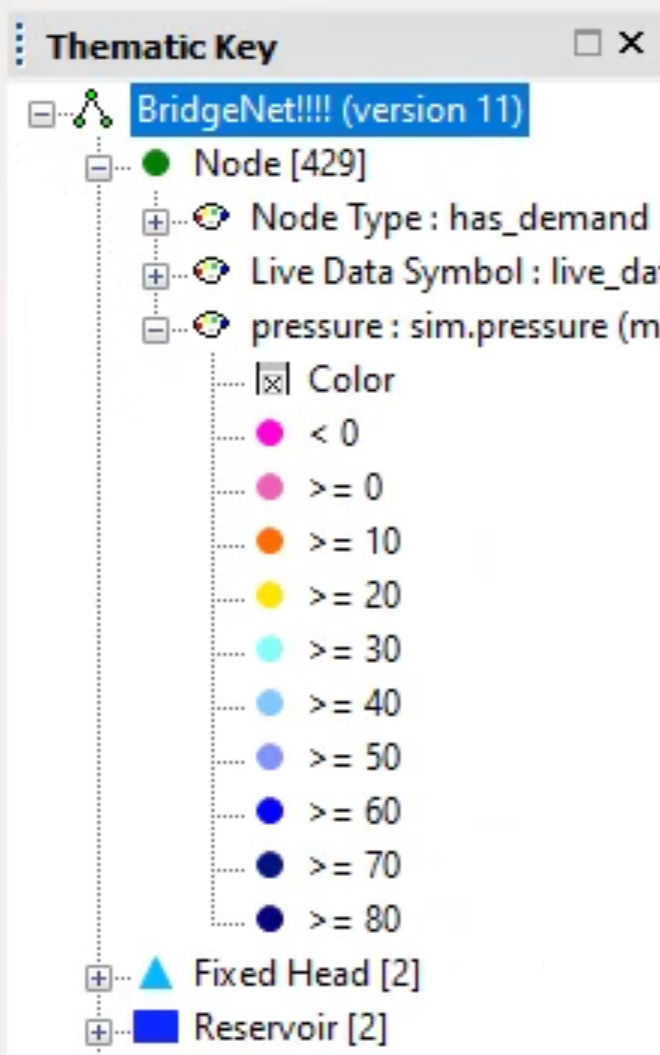
To understand what each color represents:
- In the toolbar, click Thematic key window.
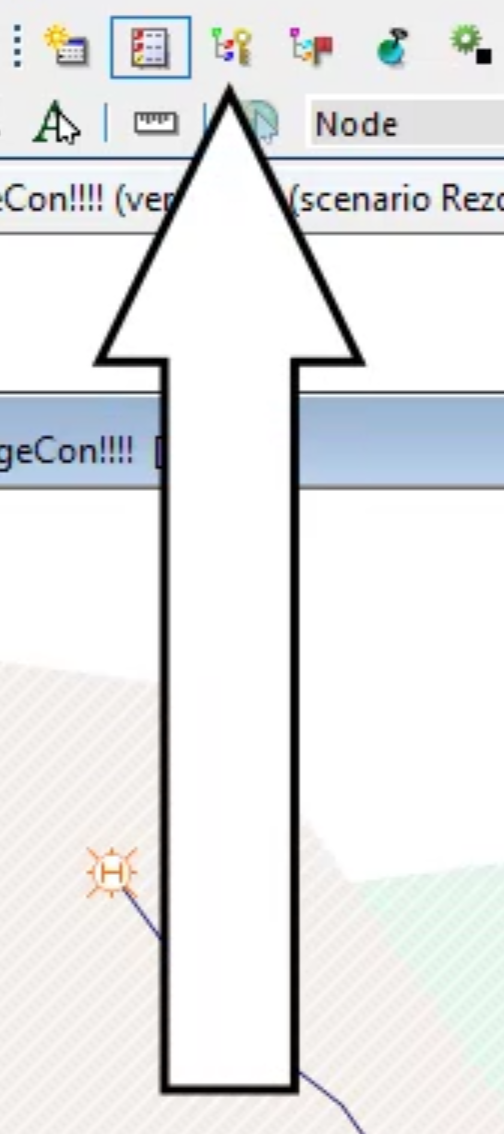
- In the Thematic Key Window, expand Node and pressure to review the color key relating to water pressure.
- Locate pipe 144688 again.
Notice that with the pipe closed, the drop in pressure in the network is downstream, but with the valve open, flow is maintained.
To apply an SQL to review individual customer pressure:
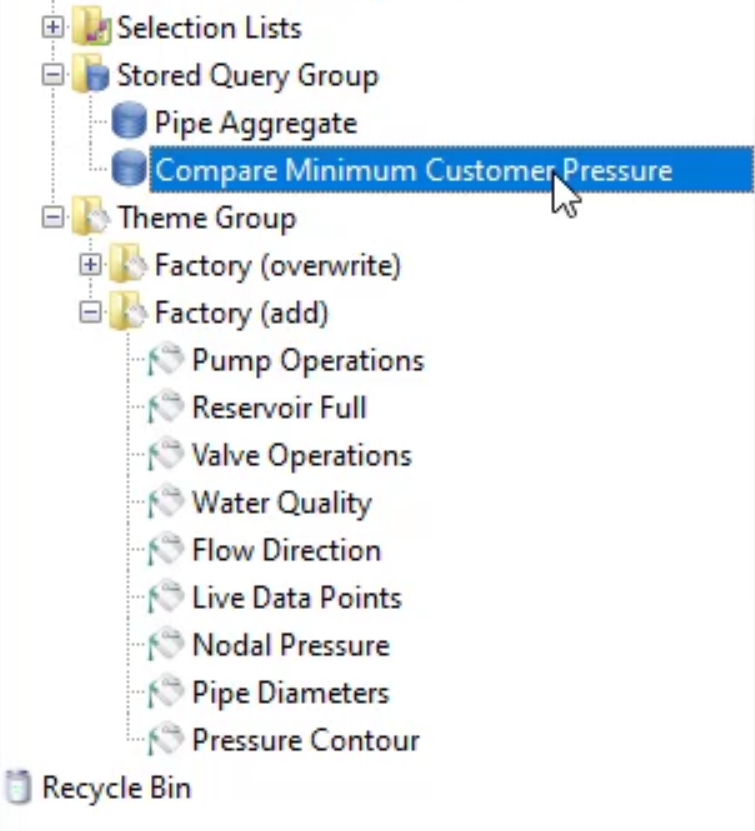
- In the Model Group window, expand Stored Query Group.
- Double-click Compare Minimum Customer Pressure.
- In the SQL dialog box, deselect Apply Filter To Current Selection.
- Click Run.
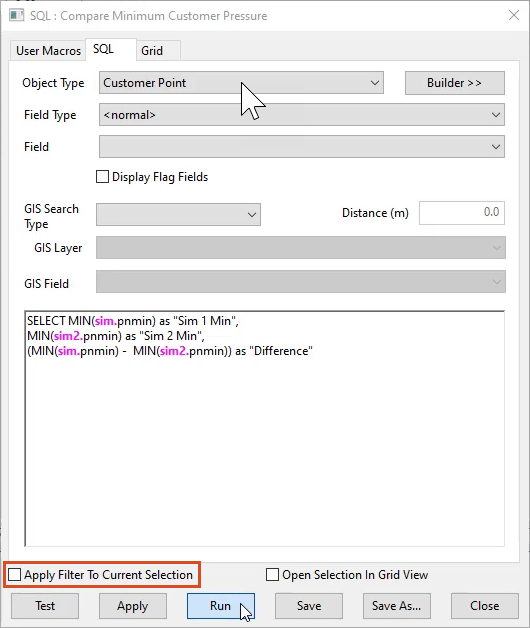
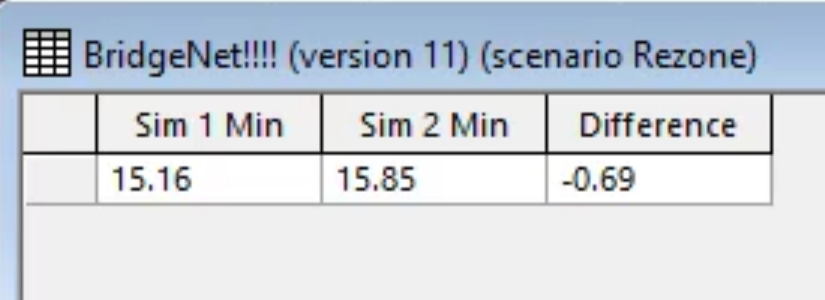
In the results window, Sim 1 represents the Rezone run, and Sim 2 represents the Base run. The Difference of –0.69 indicates only a small drop in pressure. Therefore, the rezone was somewhat successful.
