Step-by-step Guide
When using InfoWorks WS Pro, there are several ways to view simulation results to better understand how a model is performing, and to make it easier to locate and address mistakes.
- In the Model Group window, expand Run Group > BridgeTown Base. If BridgeCon is slightly transparent, right-click BridgeTown Base and select Re-run.
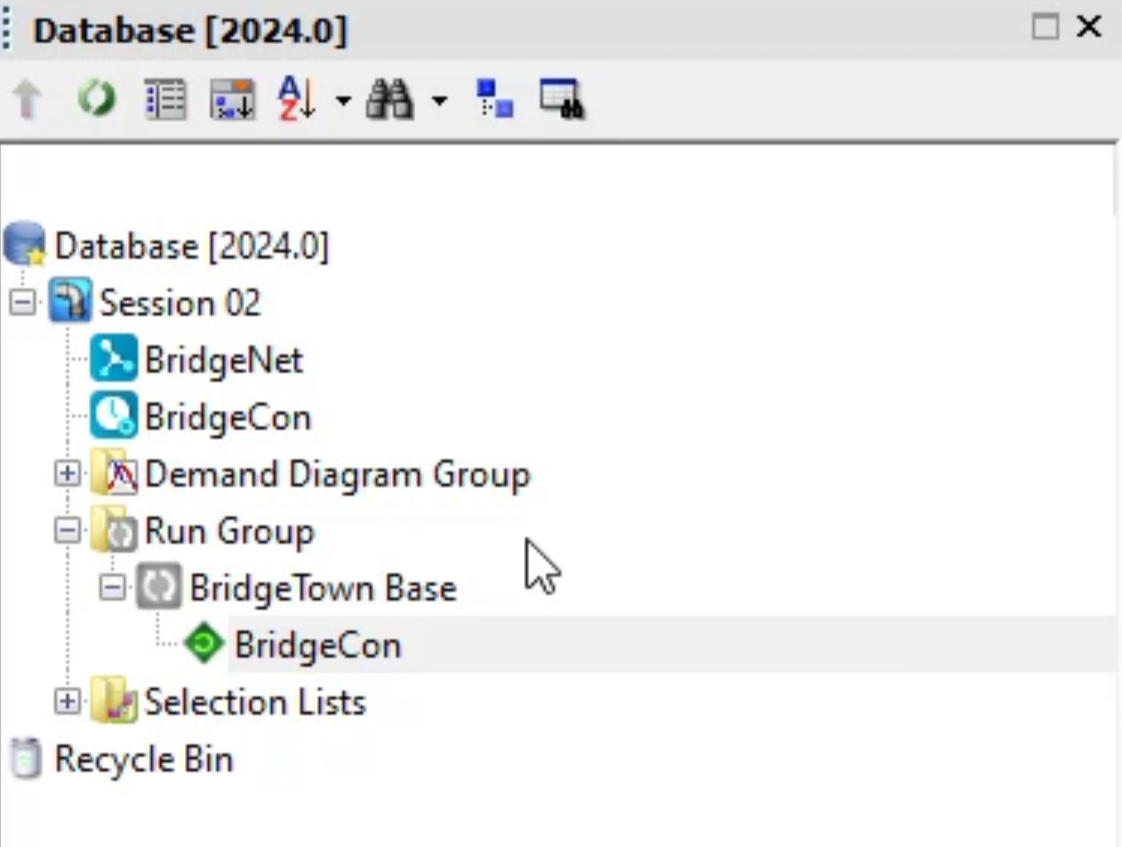
- Drag and drop BridgeCon from the Model Group window into the GeoPlan to view its results.
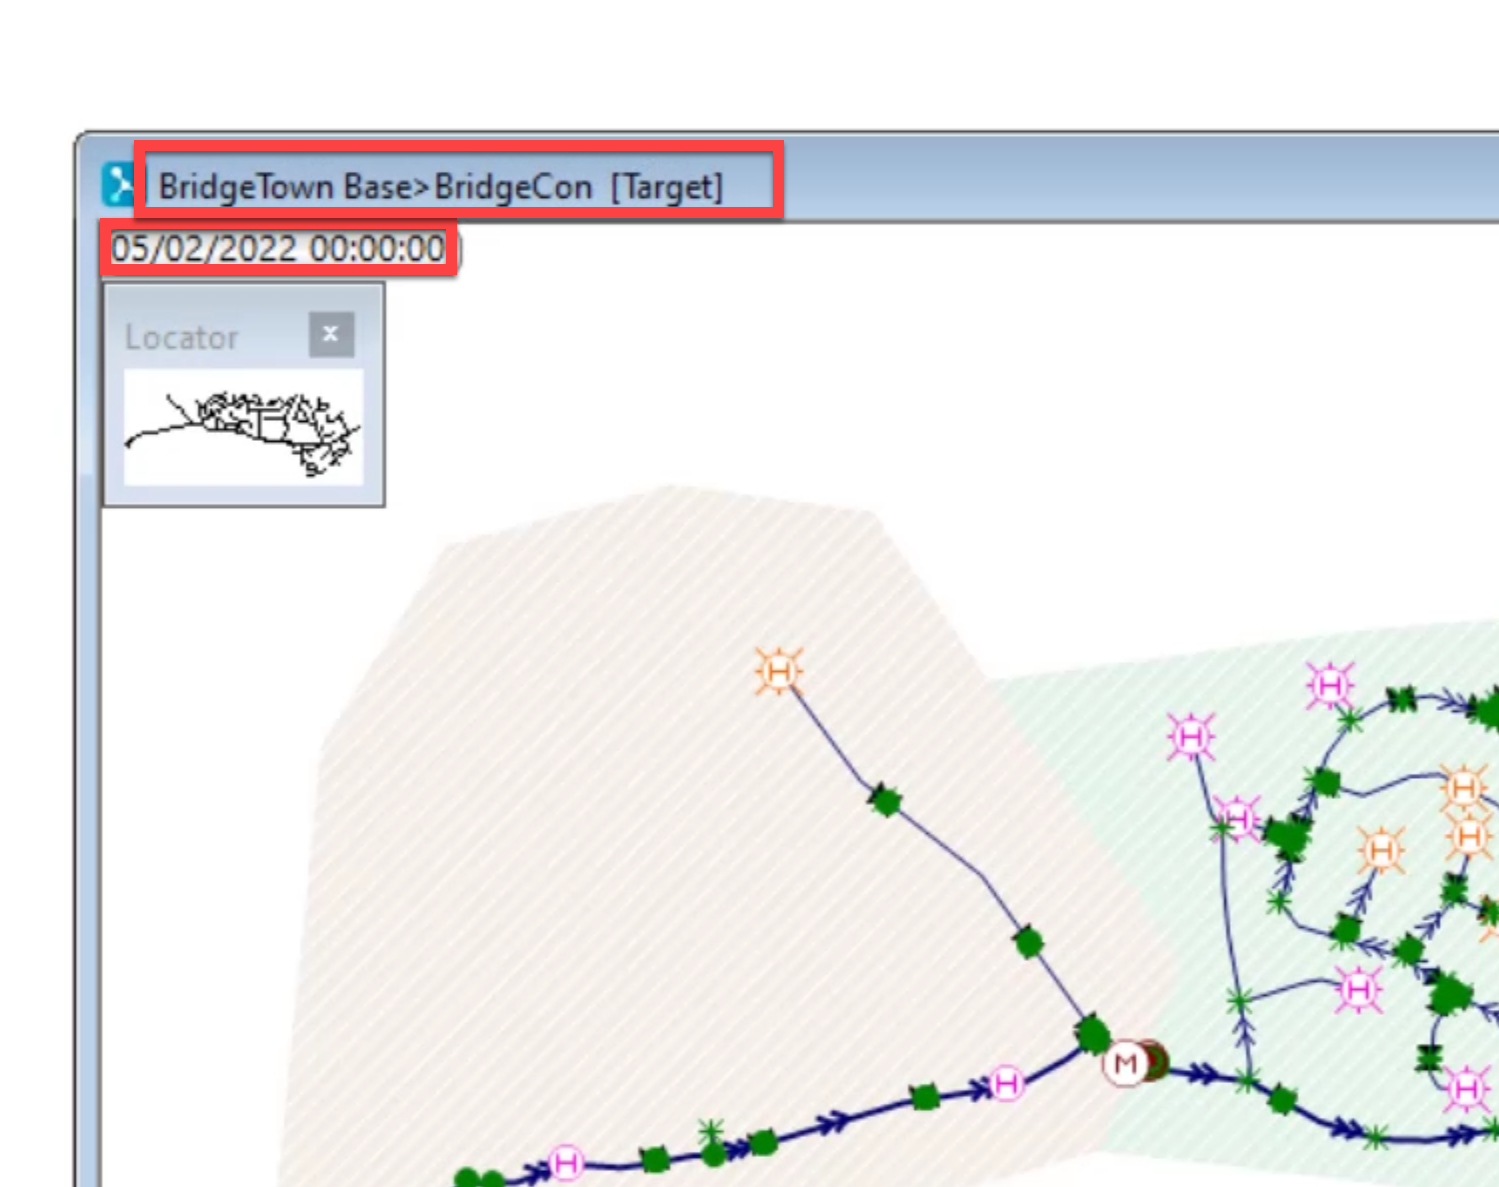
Note: Simulation results are read-only, so changes cannot be made within the results GeoPlan.
Note: The results window displays the date and time of the run and an angle bracket (>) between the name of the run group and the run.
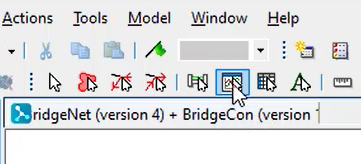
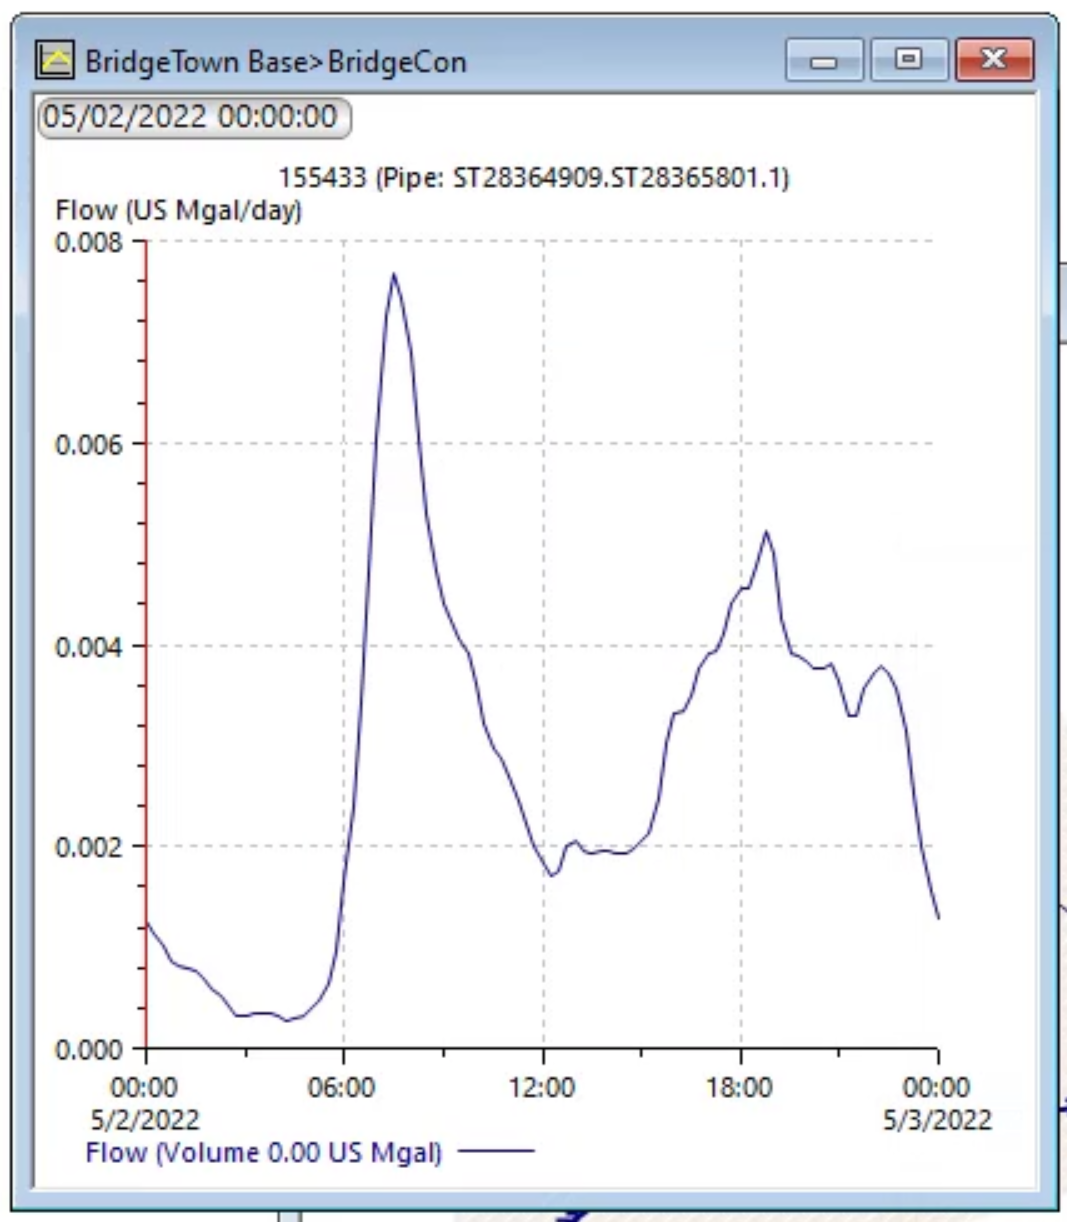
- To review the results as a graph, in the toolbar, click Graph.
- In the GeoPlan, pick an object in the network, such as a pipe.
- In the Selection dialog box, click Flow.
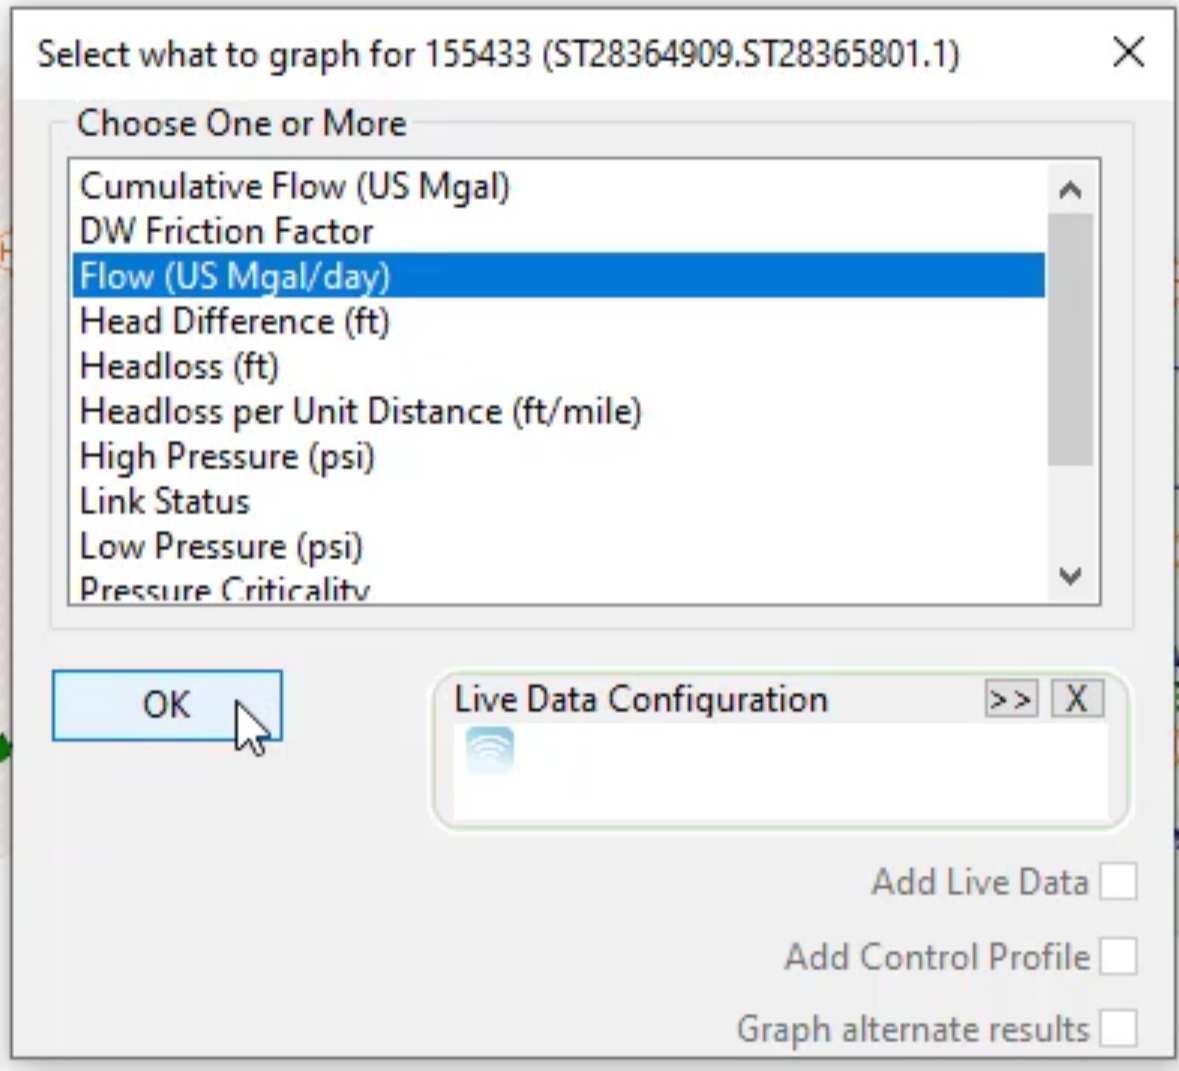
- Click OK.
- Review the graph detailing the flow through the pipe (Y-axis) over a 24-hour period (X-axis).
- Close the graph.
- In the GeoPlan, review the arrows on pipes. The direction of the arrows depicts the direction of water flow.
To move the simulation timeline:
- On the date and time panel, click different points on the date and time panel.
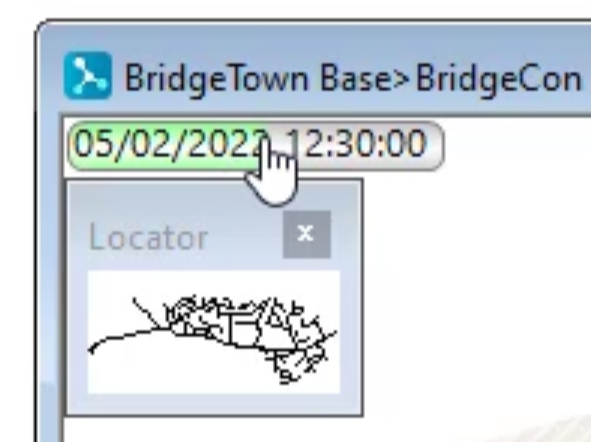
Notice any flow direction changes.
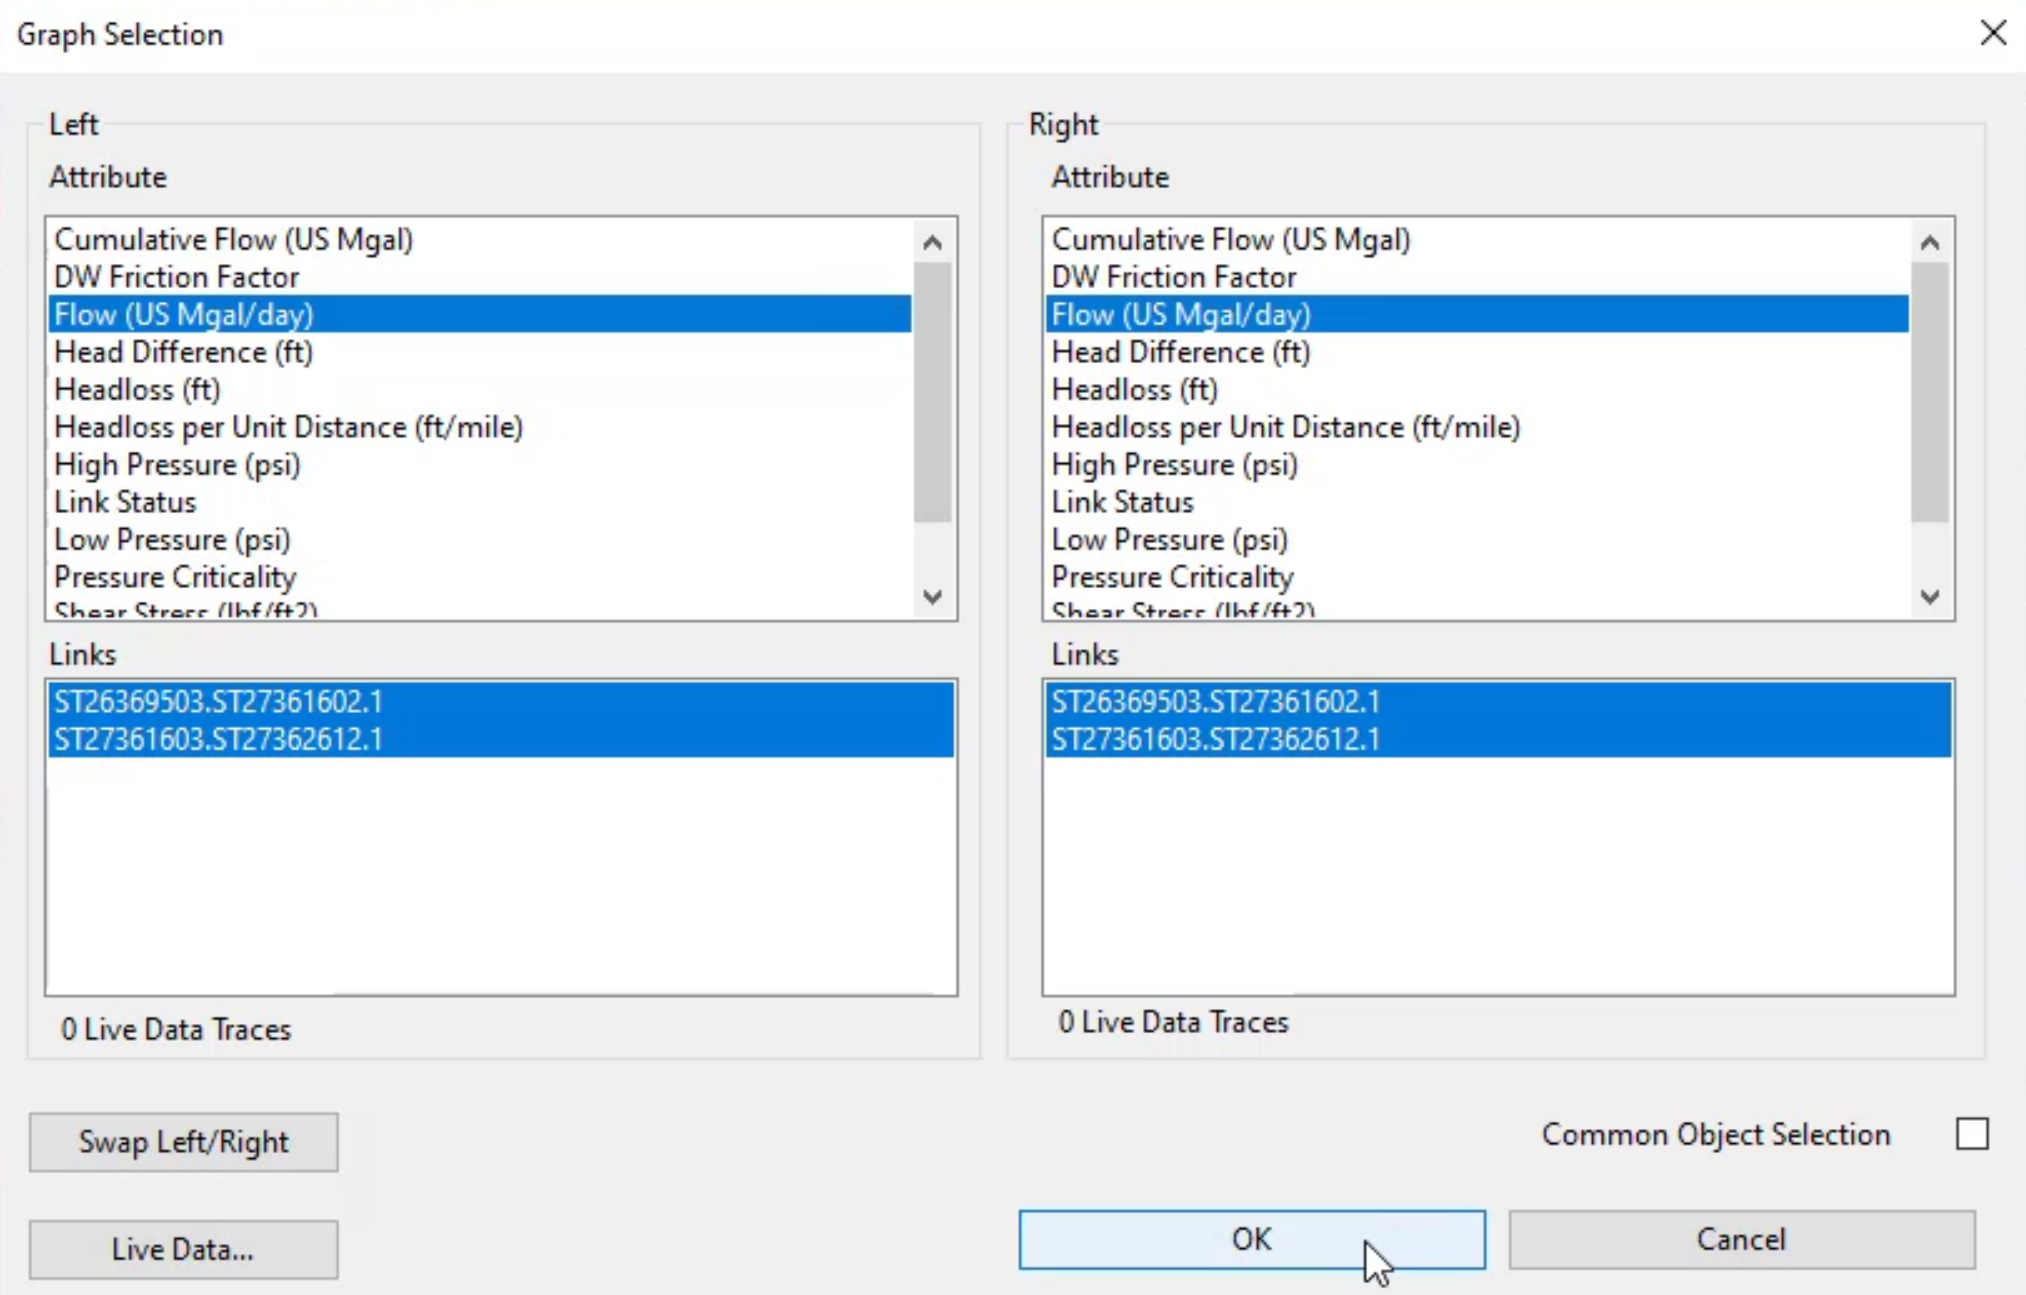
To graph results for more than one object:
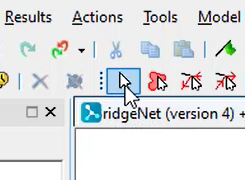
- In the Tools toolbar, click Select.
- In the GeoPlan, click any object in the network, such as a pipe.
- On your keyboard, hold CTRL and click another object, such as another pipe.
- In the Tools toolbar, select Graph selected objects.
- In the Graph Selection dialog box, under Left Attribute, select Flow.
- Under Right Attribute, select Flow.
- Click OK.
- Review the graph in the Multiple Objects window.
- Close the window.
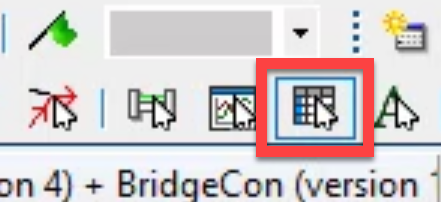
To view results in a grid format:
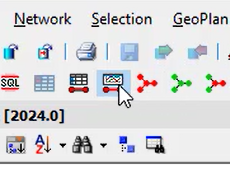
- In the toolbar, select Grid.
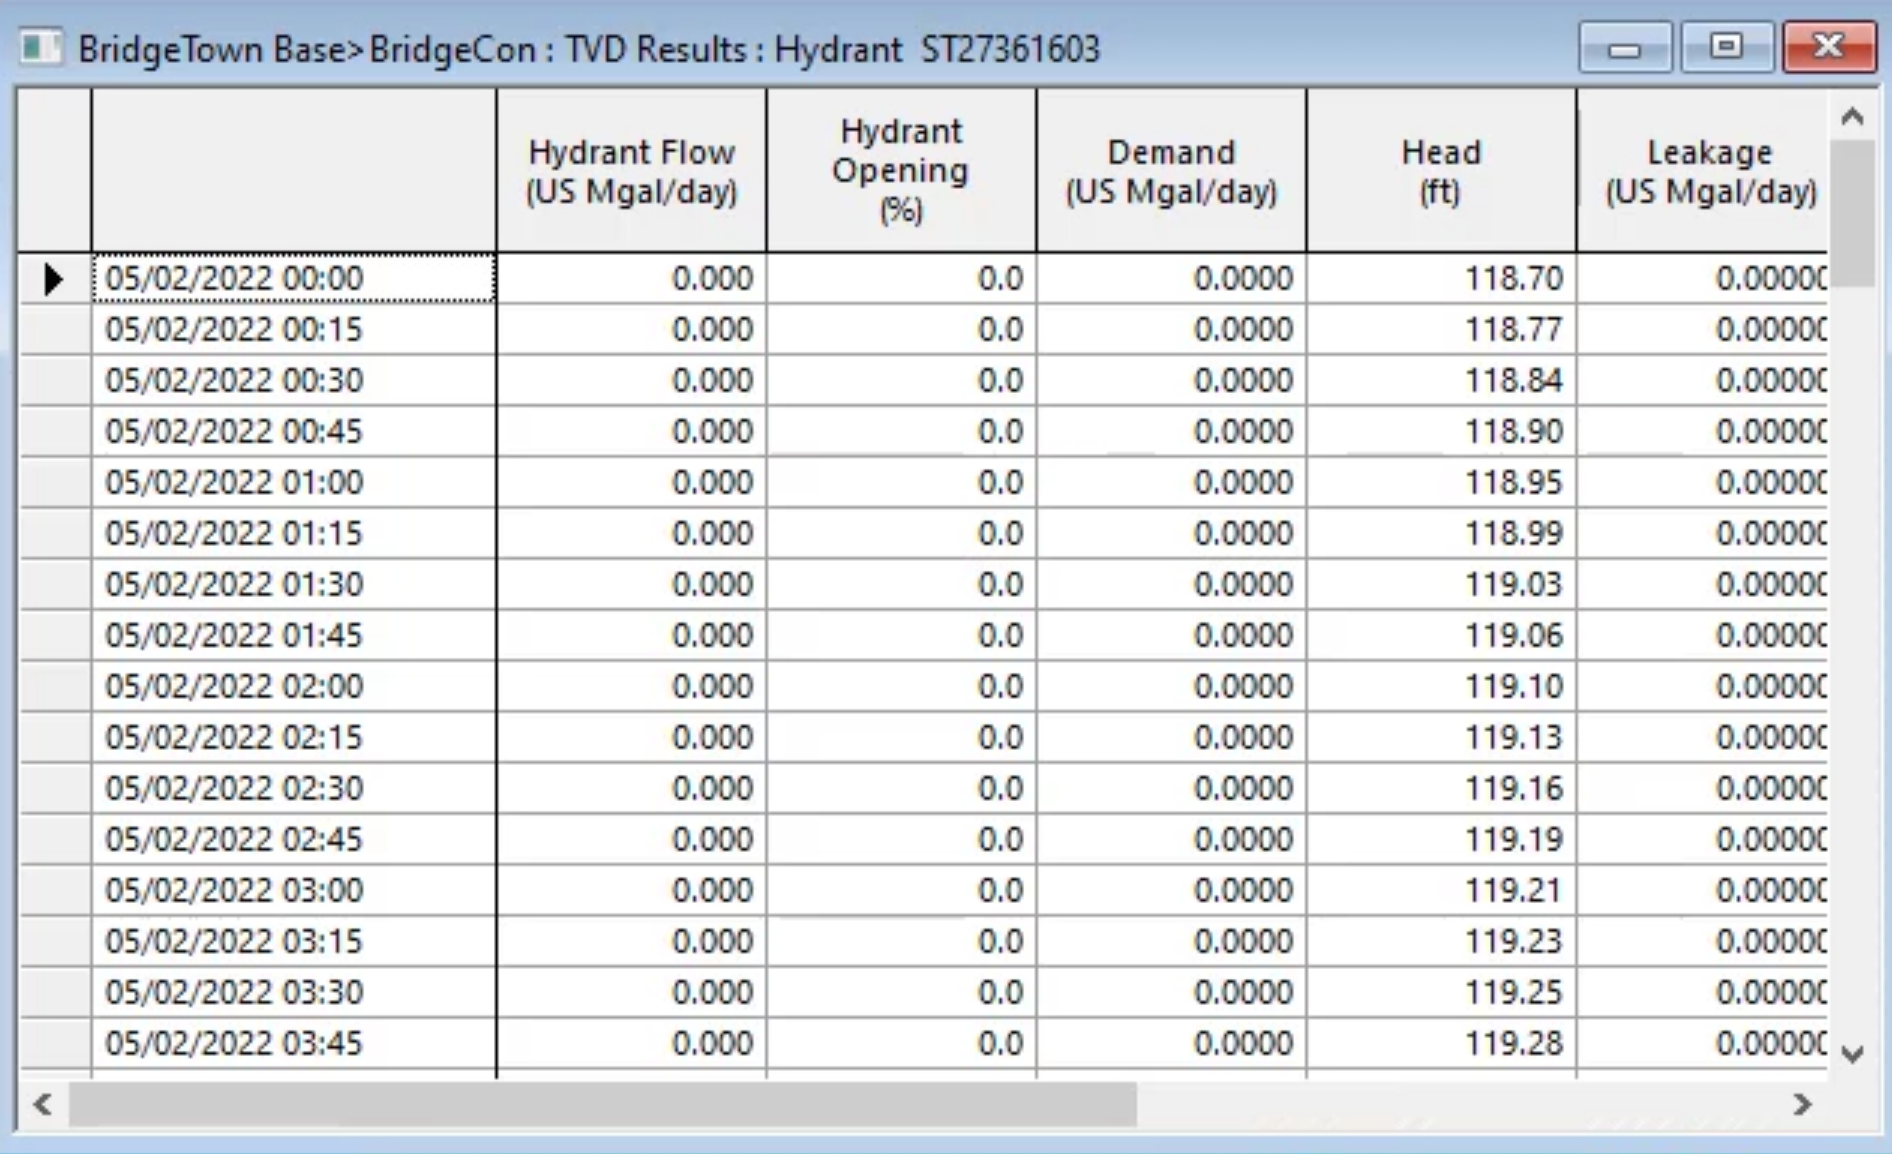
- In the GeoPlan, pick an object in the network, such as a hydrant.
- Review the grid that shows the date and time by row and the object’s attributes.
Note: You can copy and paste this grid into a spreadsheet, if necessary.
- Close the grid.
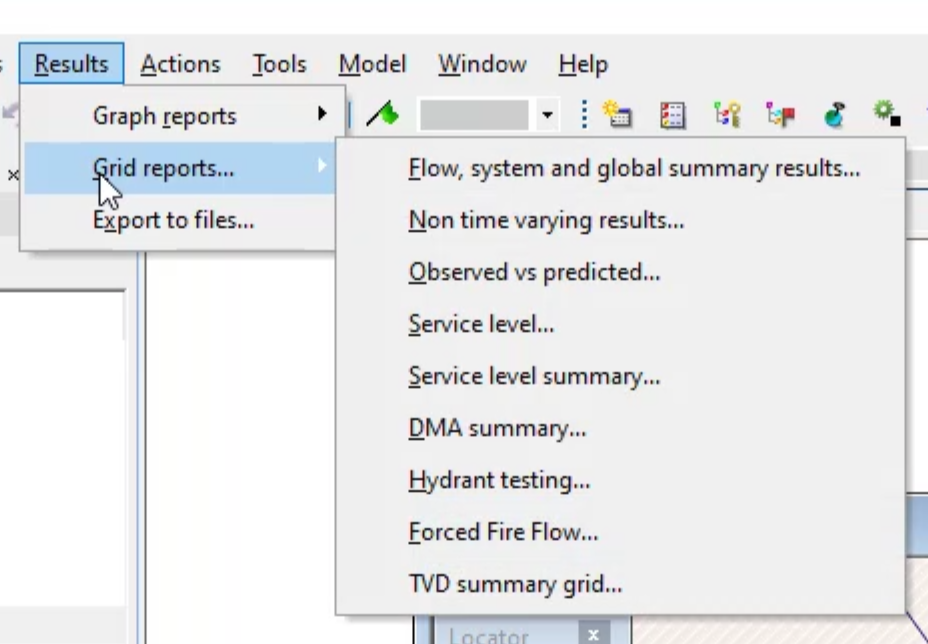
- To review results in other graph formats, select Results > Graph reports and select an option.
- To review results in other grid formats, select Results > Grid reports and select an option.
- To export results, select Results > Export to files.
- In the Export Results Data Files dialog box, choose the data you want to export.


