Exporting summary data

Video quiz

Which of the following is an example of summary data?

(Select one)
Select an answer

1/1 questions left unanswered

Step-by-step Guide

InfoWorks WS Pro allows users to export both time varying data (TVD) and summary data.

Summary data provides a summary of the Time Varying Data, such as maximum, minimum, and average values. This functionality can be useful for exporting large numbers of objects for comparison.

This example exports a summary report of the average, minimum, and maximum pressure values for a selection of customers to CSV.
  1. Create a new folder with the name “Results” to store the results of this exercise.
  2. From the Model Group window, drag-and-drop a completed run with results into the workspace to open the simulation GeoPlan.
  3. Zoom into a part of the network populated with customer points.
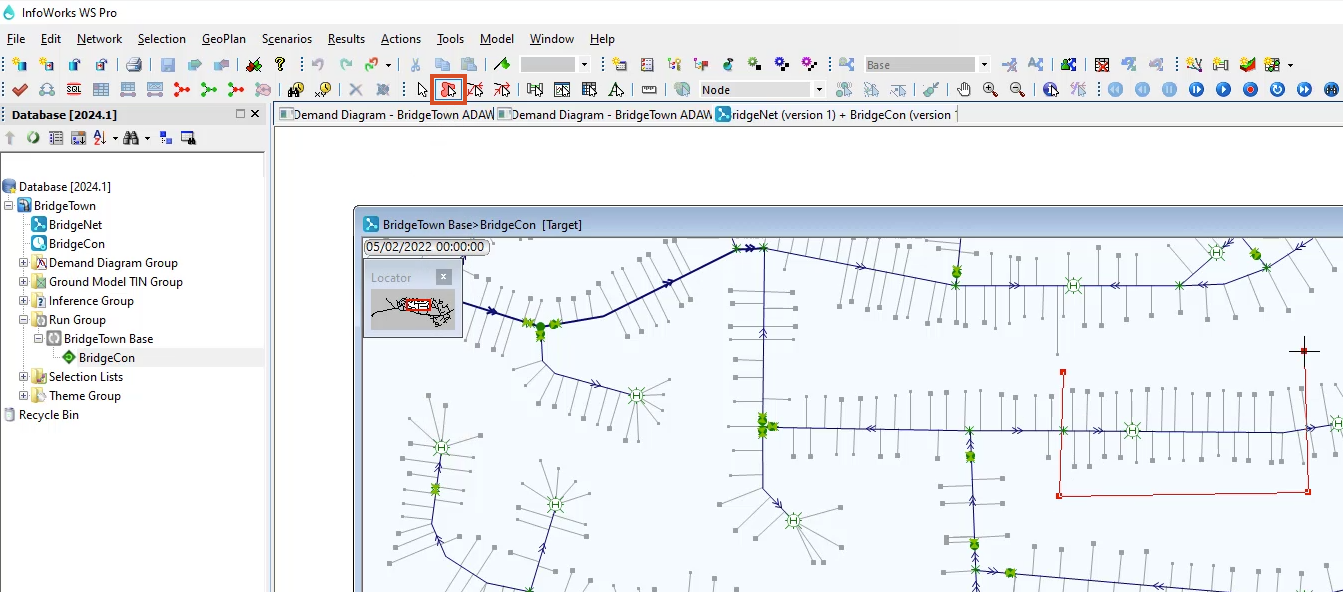
  4. In the Tools toolbar, click the Polygon select tool.
  5. Click to draw the vertices of a polygon around several customer points.

The InfoWorks WS Pro interface, Tools toolbar, with the Polygon select tool highlighted in red, and a zoomed in view of the BridgeCon GeoPlan, with a polygon being drawn in red around several customer points.

Note: The selection may include other objects.
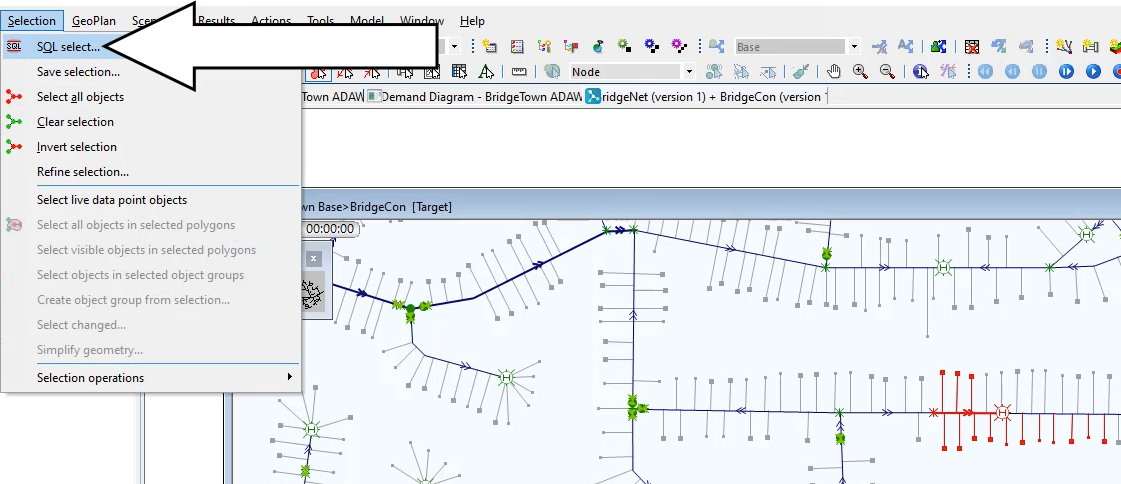
  1. In the Selection menu, pick SQL Select.

In the Selection menu, SQL Select selected, and in the GeoPlan, the selected customer points highlighted in red.

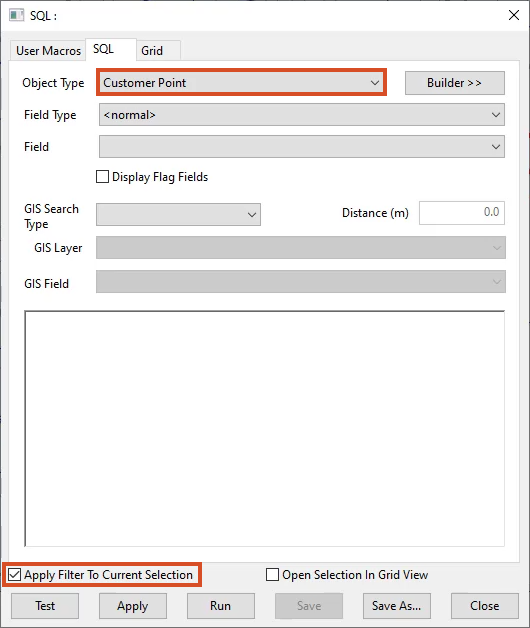
  1. In the SQL dialog box, expand the Object Type drop-down and select Customer Point.
  2. Check the box next to Apply Filter to Current Selection.

In the SQL dialog box, Customer Point selected in the Object Type drop-down and Apply Filter to Current Selection enabled.

  1. Enter the following query into the text box:

SELECT

reference AS ‘Key’,

sim.pnavg AS ‘Average Pressure’,

sim.pnmax AS ‘Max Pressure’,

sim.pnmin AS ‘Min Pressure’
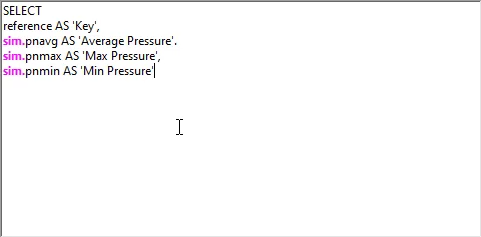
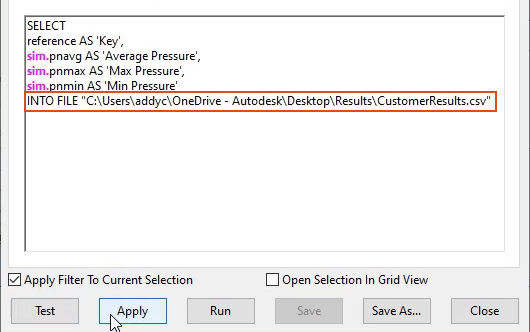
In the SQL dialog box, the text box with the query entered.

  1. Click the Test button.
  2. Click OK in the valid syntax notification.
  3. Click Apply.

A grid appears displaying the average, minimum, and maximum pressures of all the selected customer points. The contents can be copied and pasted into a spreadsheet.
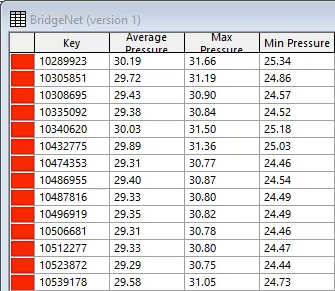
A grid displaying Average Pressure, Max Pressure and Min Pressure for the selected customer points.

OR, to Export the contents to a CSV file:
  1. Close the grid results window.
  2. In the SQL dialog box, start a new line in the query and type: INTO FILE ”
  3. In a file explorer window, navigate to the Results folder created previously.
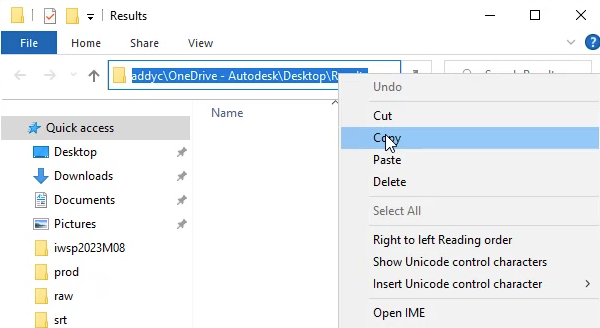
  4. Click the address bar to display the full path of the folder.
  5. Right-click the path and select Copy.

In a file explorer window, the path of the Results folder highlighted in the Address bar, and in its shortcut menu, Copy selected.

  1. In the WS Pro SQL dialog box, press CTRL+V to paste the file path into the query.
  2. At the end of the query, type: \CustomerResults.csv”
  3. Click Apply.

In the SQL dialog box, the completed query, with the new line highlighted in red, and Apply selected.

The CustomerResults.csv file now appears in the Results folder and can be opened in a spreadsheet application.
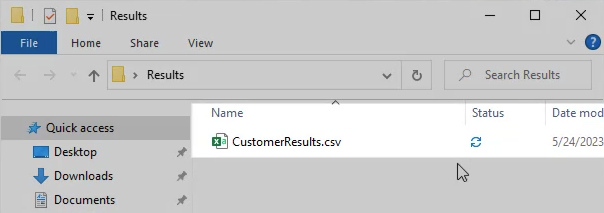
The file explorer window, Results folder, with the exported CSV file highlighted.