00:04
When you are working with info
00:06
WS pro you will need to validate models to ensure
00:09
they are hydraulically sound before simulations can be run.
00:13
The validation process involves finding errors and warnings if
00:16
any exist and then fixing them one at a time
00:20
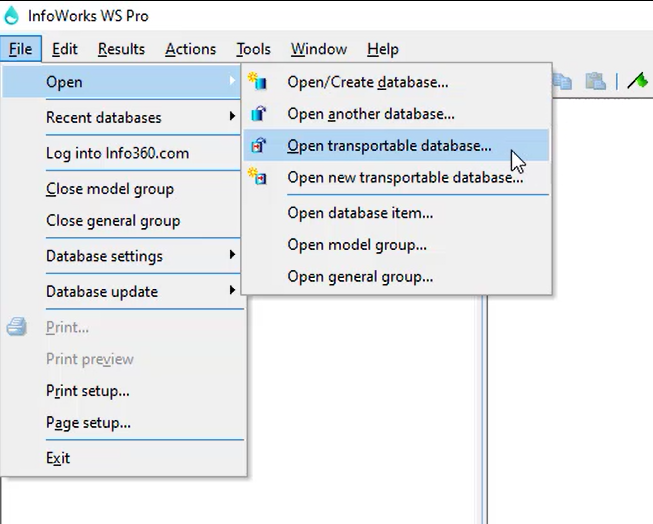
in the ribbon, click the file tab
00:23
open open transportable database,
00:26
then navigate to your desktop,
00:28
select the data folder
00:30
and locate the session three folder.
00:33
Click the file named validating models dot WPT and open it.
00:39
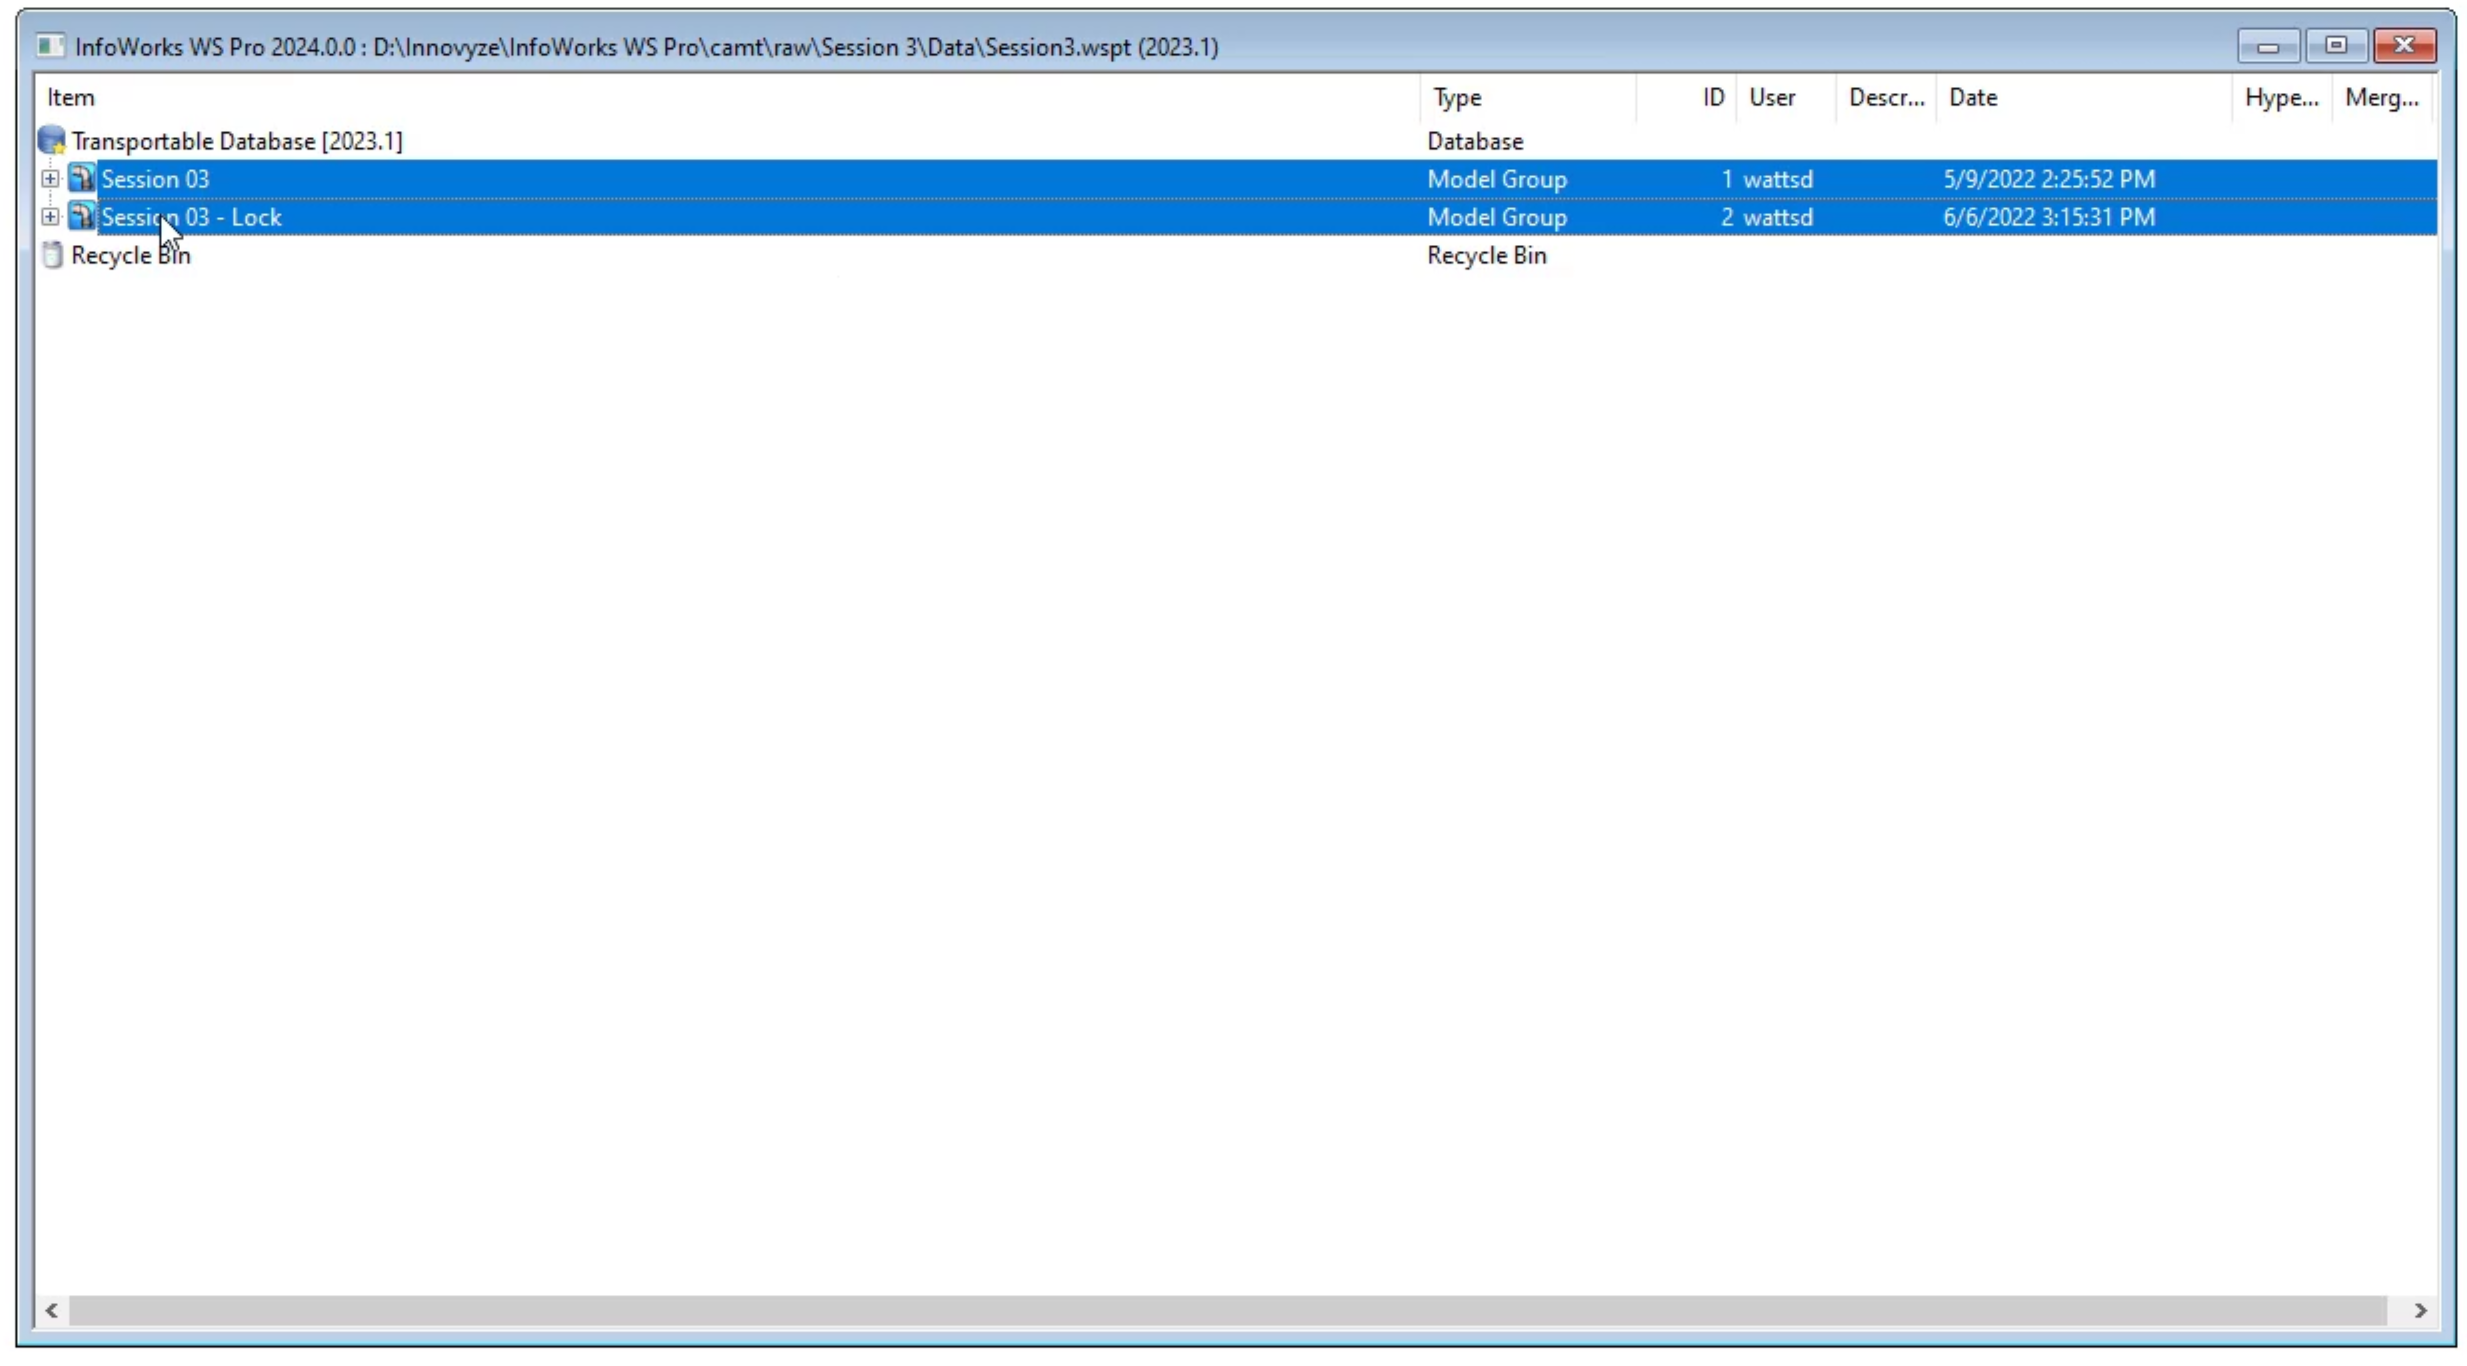
A window opens showing the contents of the transportable database
00:43
press and hold shift as you click both the session 03
00:46
and session 03 lock model groups to select both of them.
00:52
right click and select copy
00:55
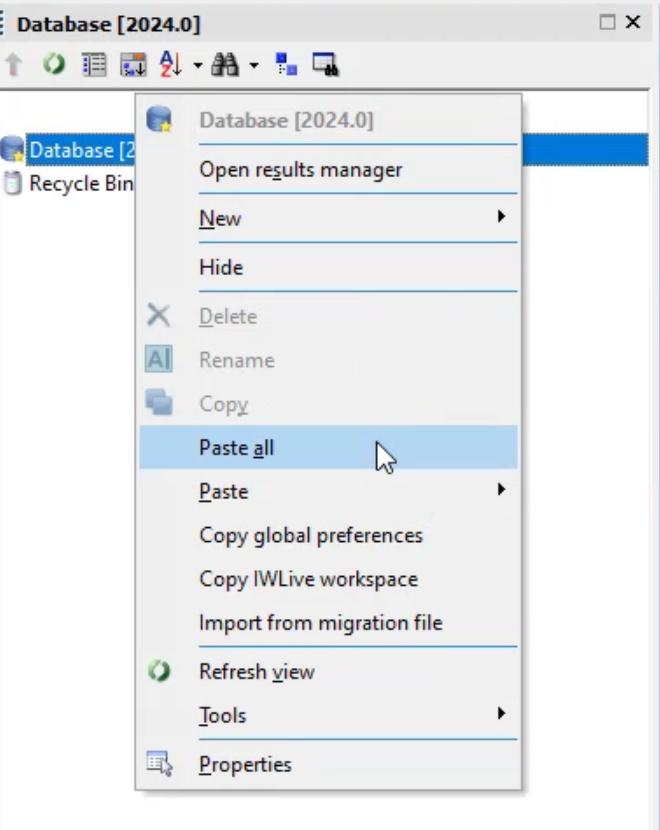
in the model group window, right click database and click paste all
00:59
close the transportable database window
01:04
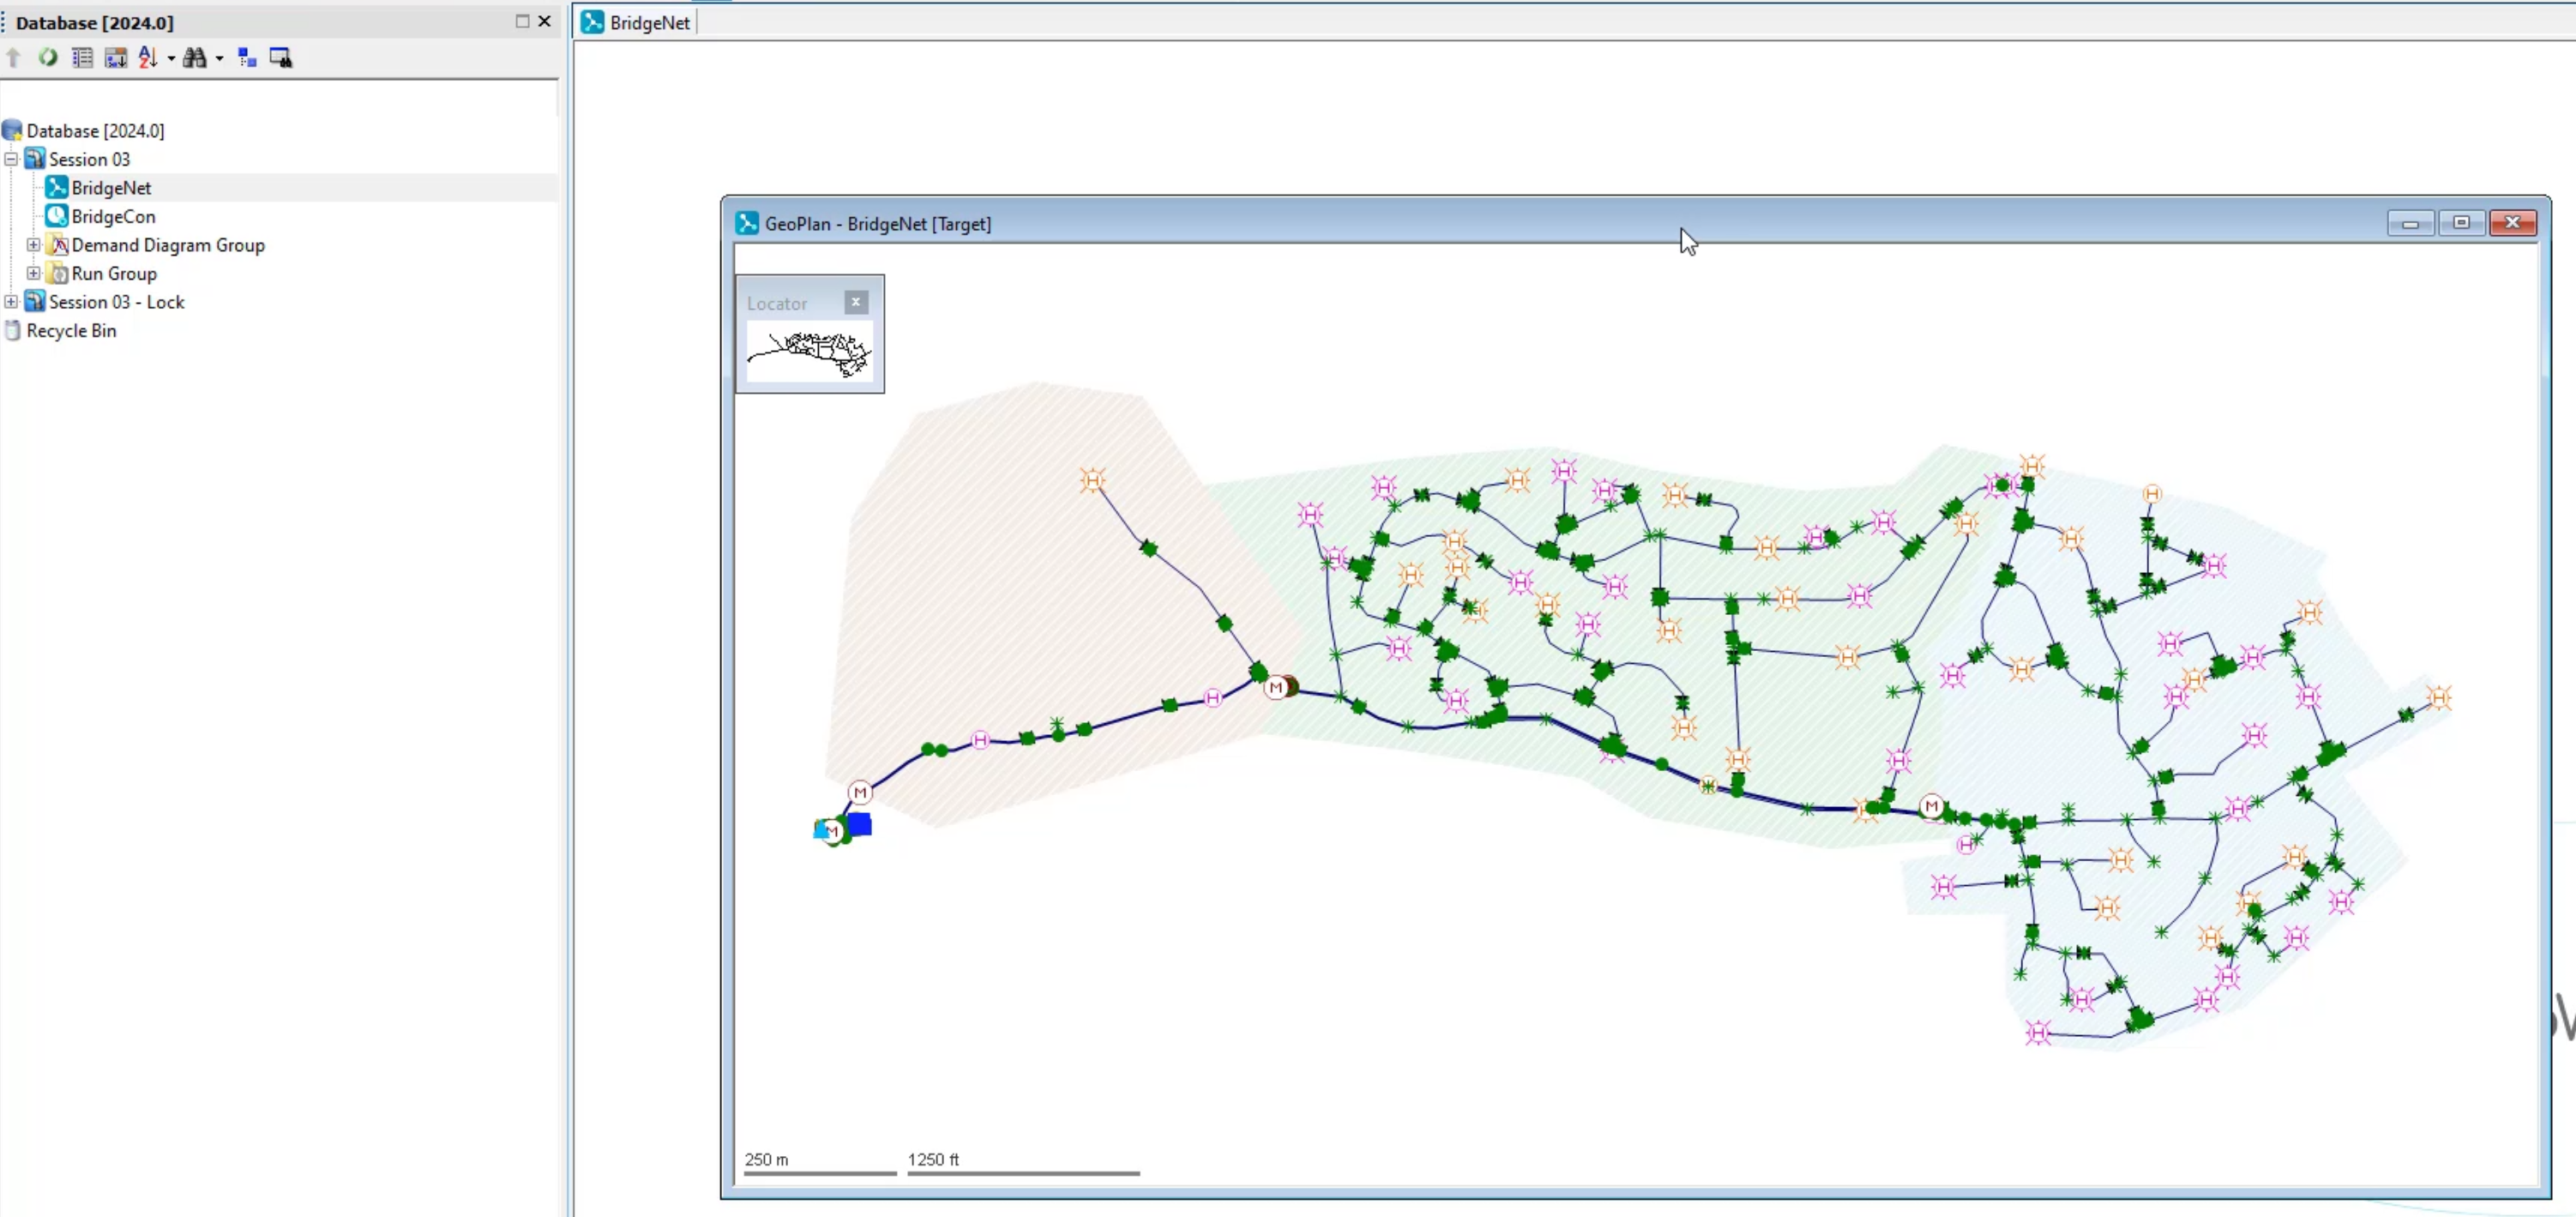
in the model group window, expand the session 03 model group,
01:08
click and drag the bridge net network to open the GEO plan and
01:12
the bridge con control from the model group window into the workspace,
01:17
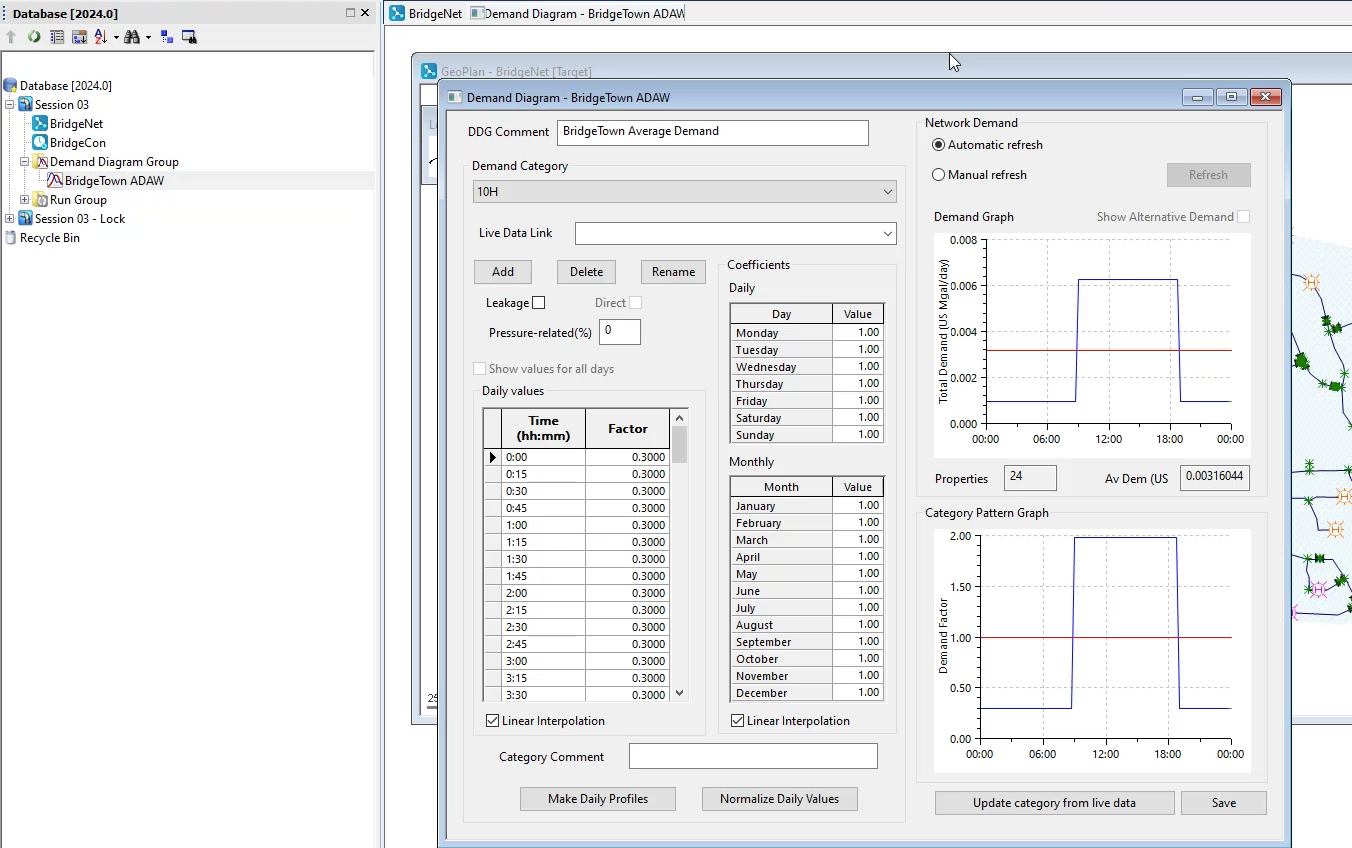
then expand the demand diagram group and click and drag
01:21
the bridgetown demand diagram to open it as well.
01:26
if you have the control and demand diagram already associated with the network,
01:30
they will open with the network
01:33
to start the validation process.
01:35
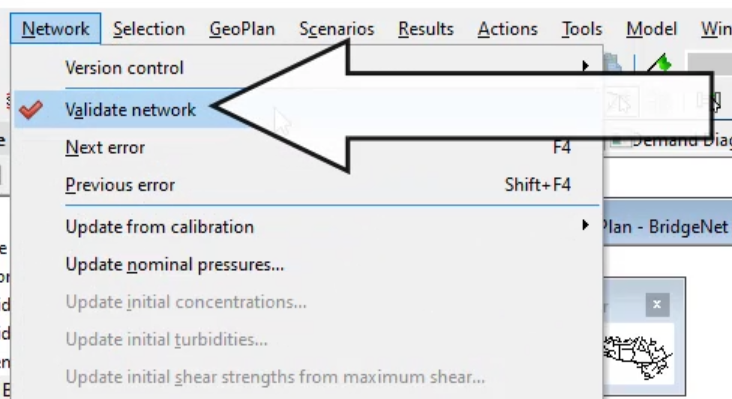
You can either click the validate button in the toolbar
01:37
or click the network tab and select validate network.
01:42
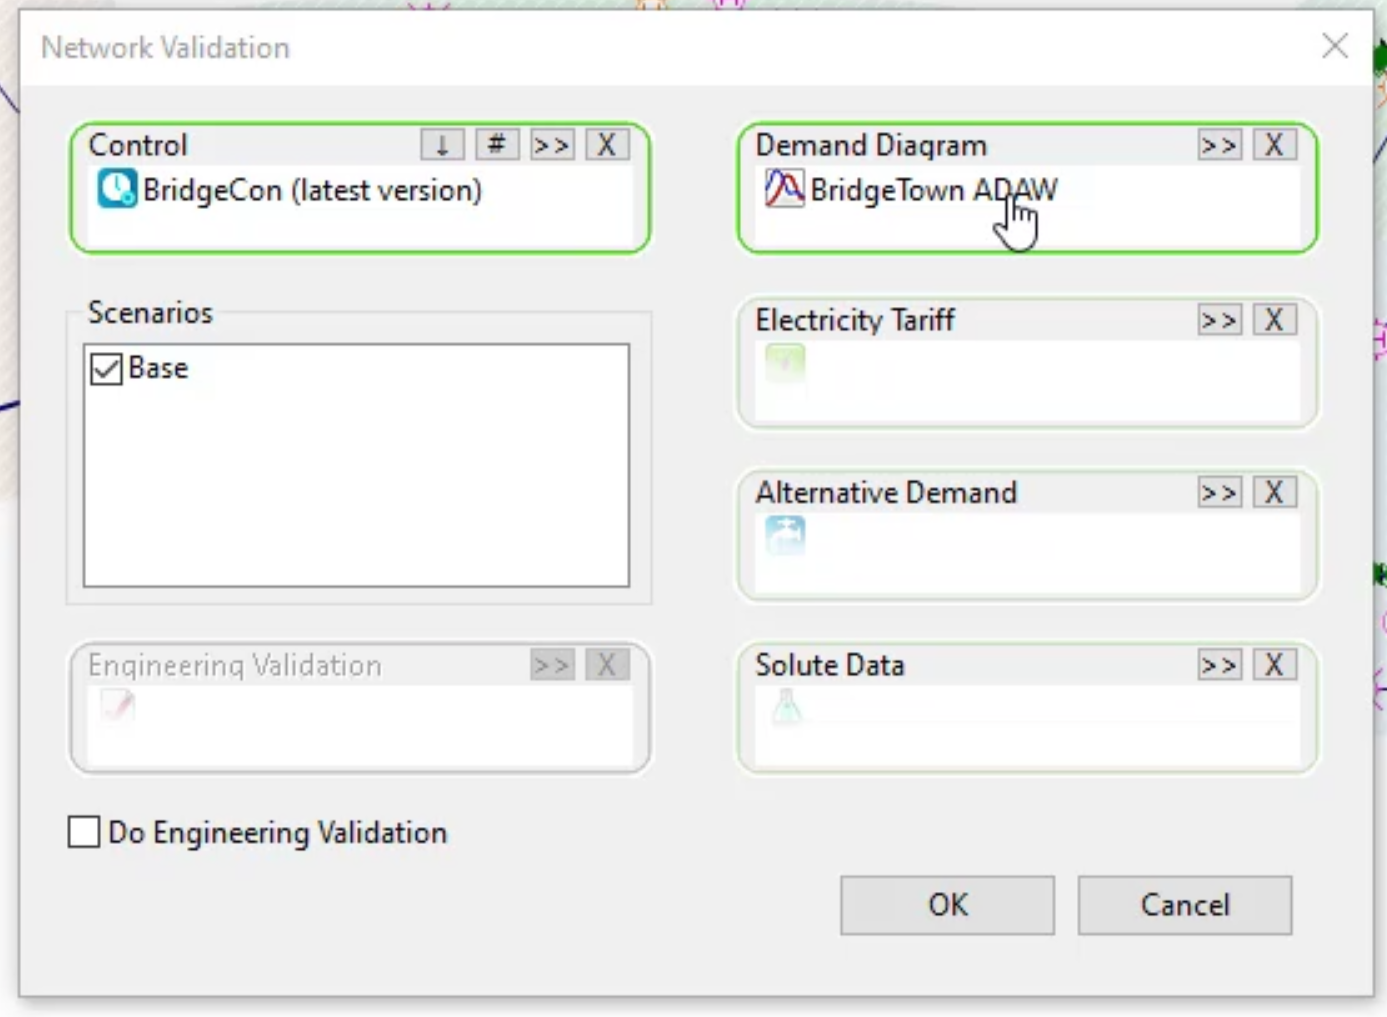
The network validation dialogue opens
01:46
you can see the network and its associated control in their respective group boxes.
01:52
If the control and demand diagram are not associated,
01:55
you will need to drag and drop them into their respective boxes,
02:01
alternative demand and solute data objects can be validated if necessary.
02:11
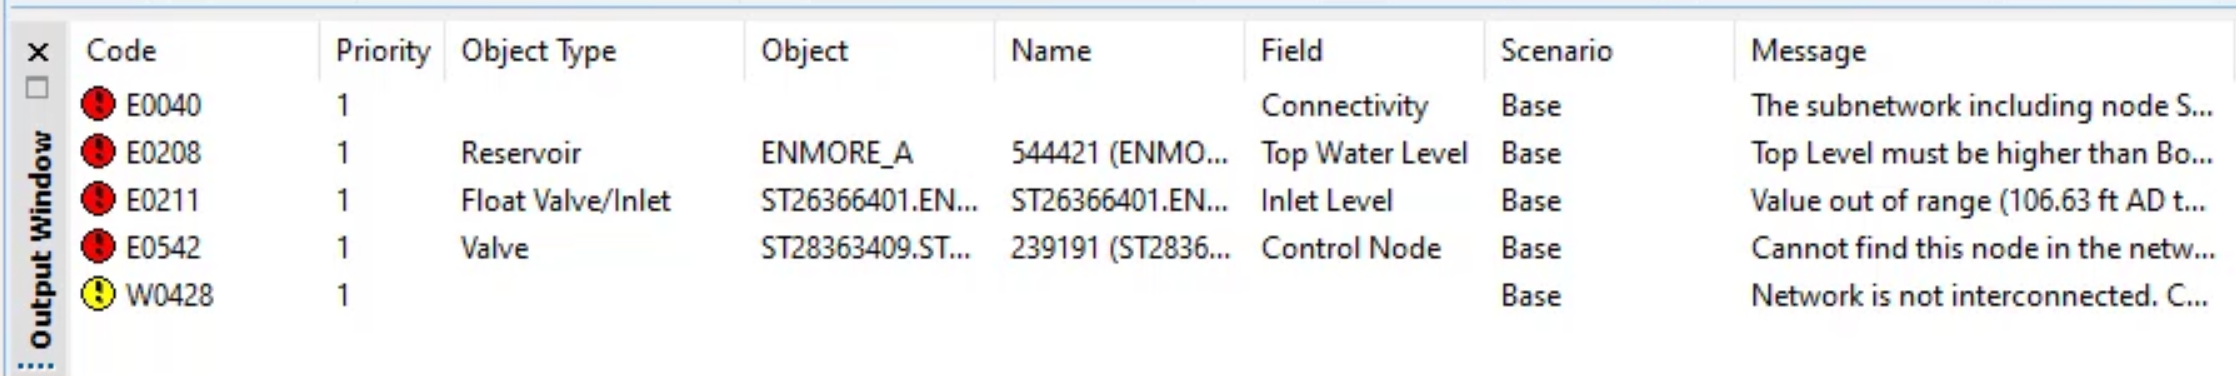
an output window appears and lists several errors and a warning,
02:16
red circles with exclamation marks indicate
02:18
errors and yellow circles indicate warnings.
02:23
Errors mean the model cannot be run until they are resolved.
02:27
Warnings mean a model can be run but
02:29
that there is something outside of default parameters.
02:32
You may not need to resolve a warning if
02:34
it represents a change or setting you intended.
02:38
Best practice is to start at the top of the list and resolve each one. In turn.
02:43
Sometimes resolving one error will solve others that may be linked to it in some way,
02:49
then rev validate the model. After fixing each error.
02:53
Double click, the error named E 0040
02:57
notice. However, that nothing happens.
02:59
This is because it is a connectivity issue as listed in the field column,
03:05
double click the next error.
03:07
This time a grid appears showing the exact location of the problem
03:12
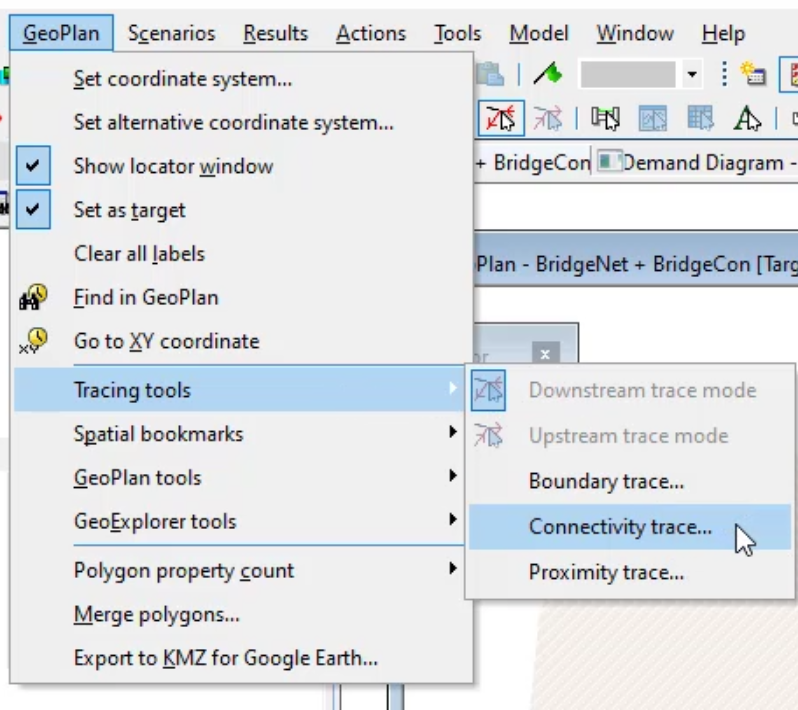
to resolve the connectivity error
03:15
GEO plan tab, select tracing tools. And then connectivity trace
03:22
found dialogue appears showing that there are two subnets
03:27
that means there is a single connectivity break somewhere
03:29
in the network separating it into two subnets.
03:35
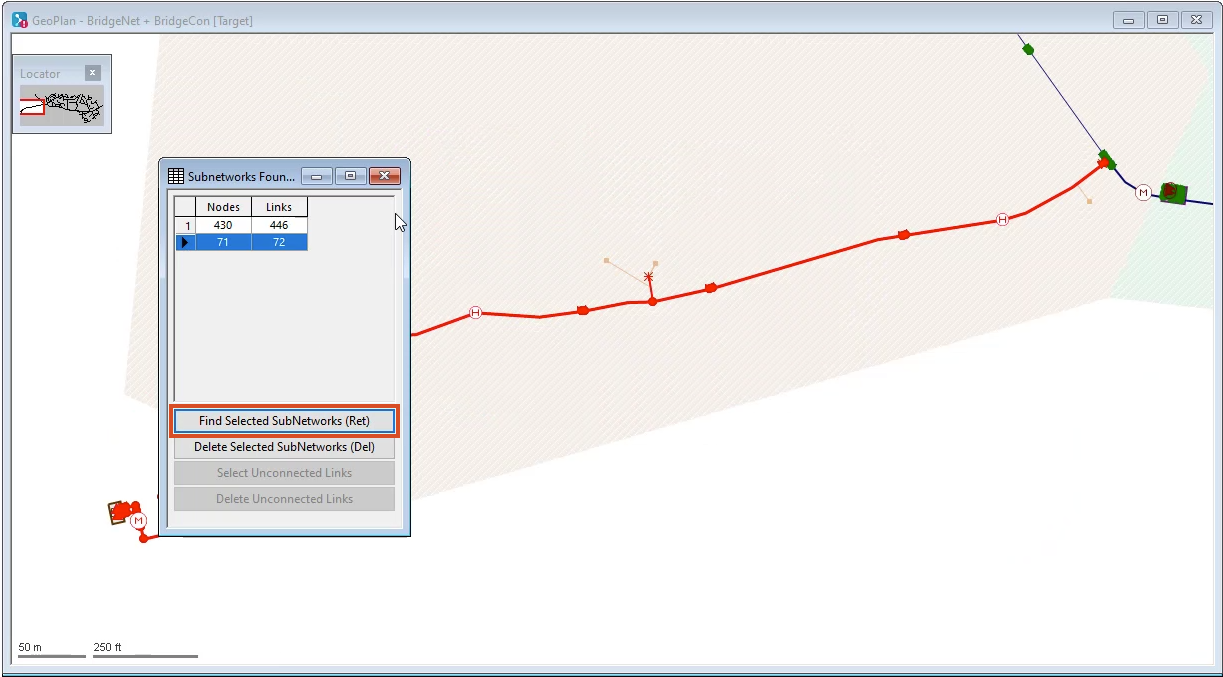
subnets in this example. The second one
03:37
and then click find selected subnets
03:42
close the dialog and then adjust the size of the output window by
03:46
clicking and dragging the right side of the window to the left.
03:50
You can now see the source of the
03:51
connectivity issue in the GEO plan highlighted in red
03:56
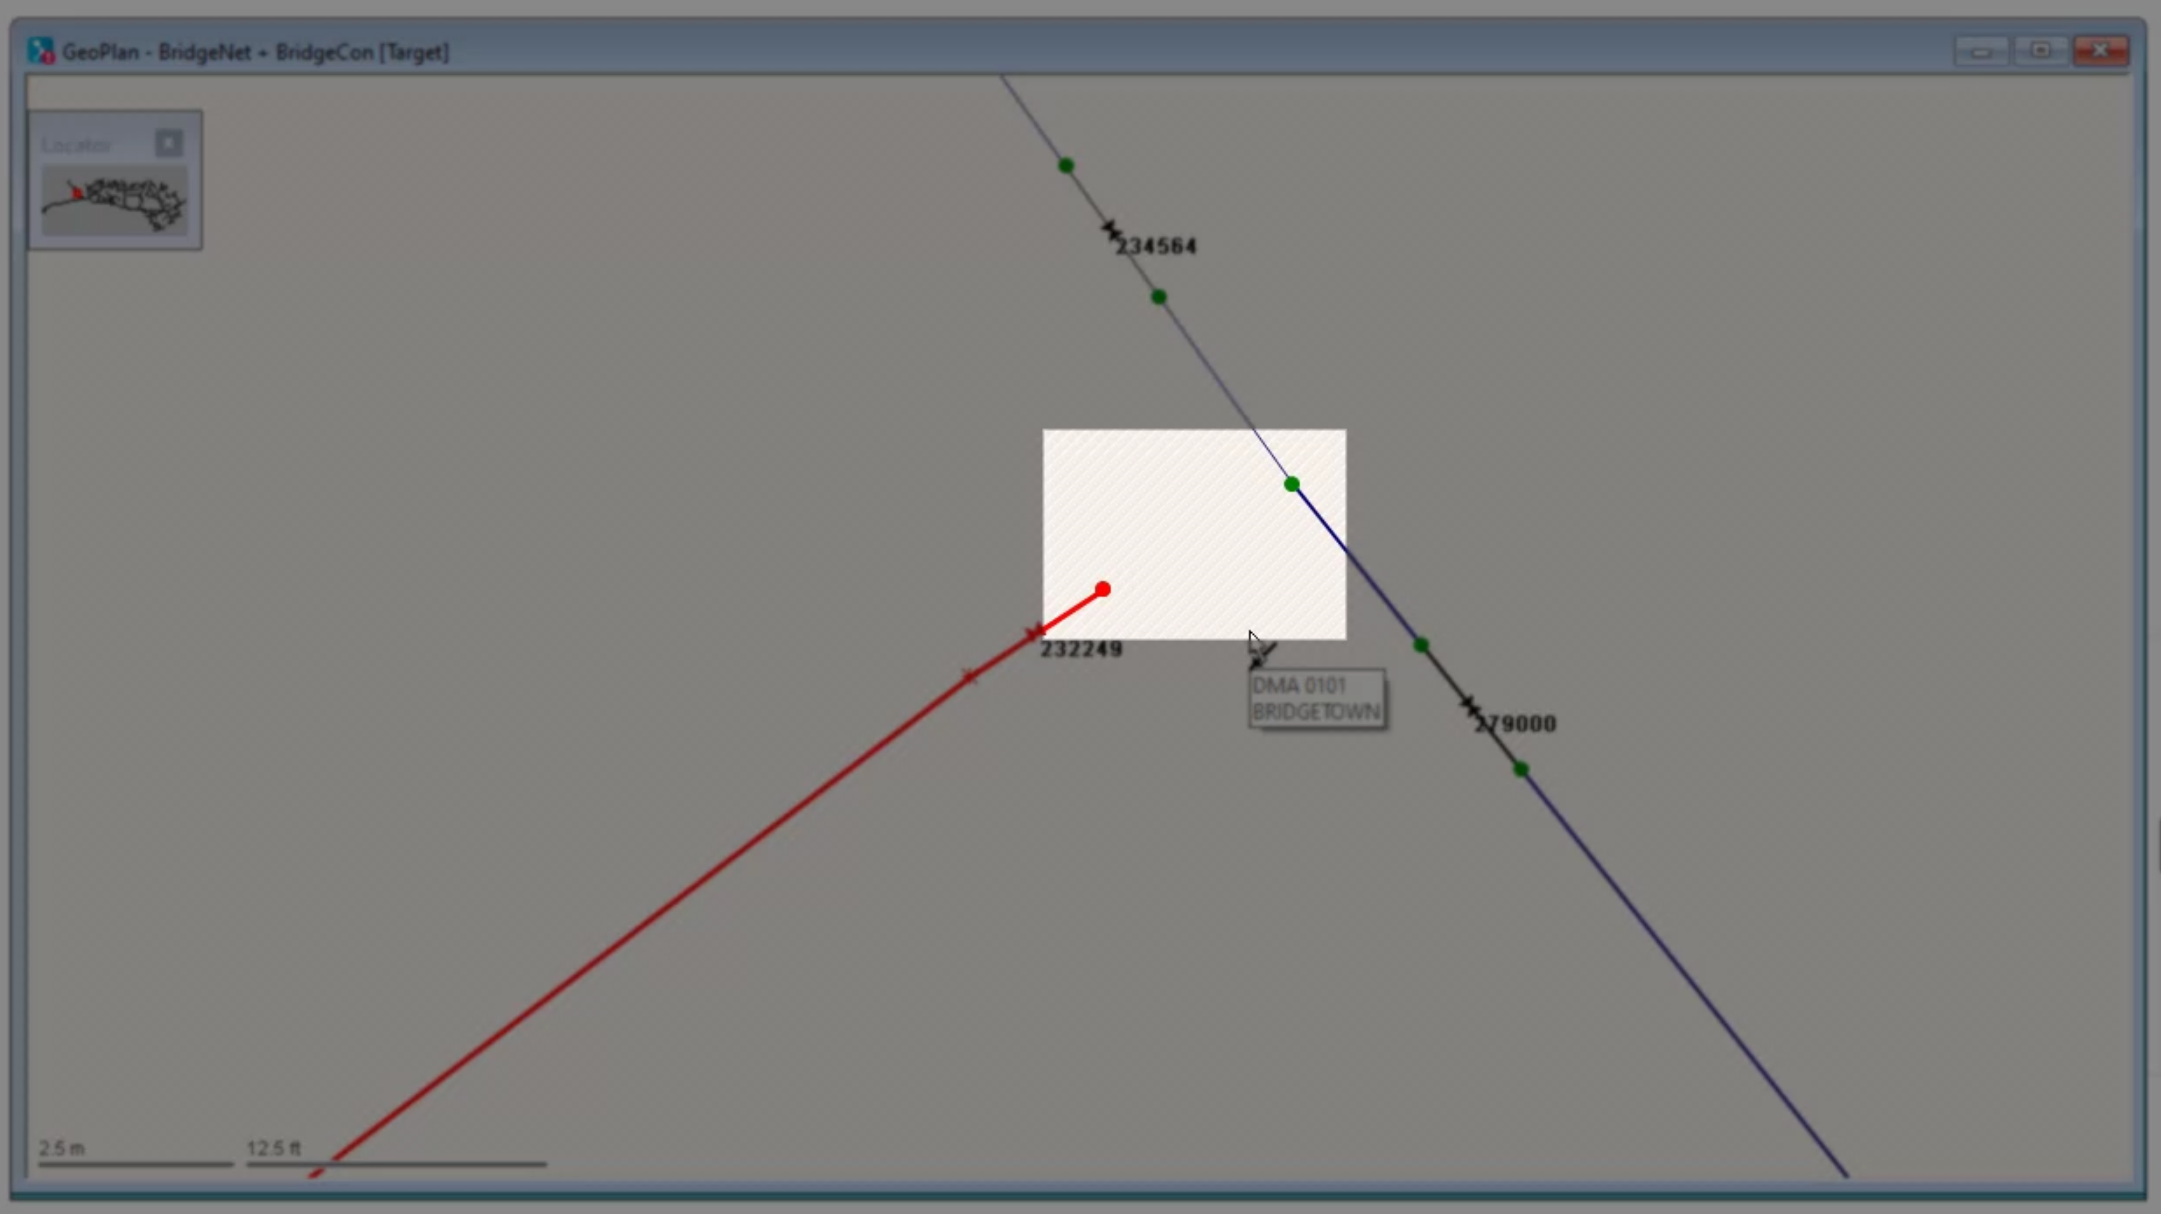
zoom in to see the error in more detail.
03:59
In this example, a junction is not complete
04:02
so water cannot flow from the reservoir upstream past this point
04:07
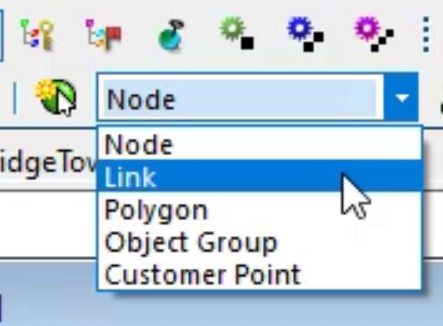
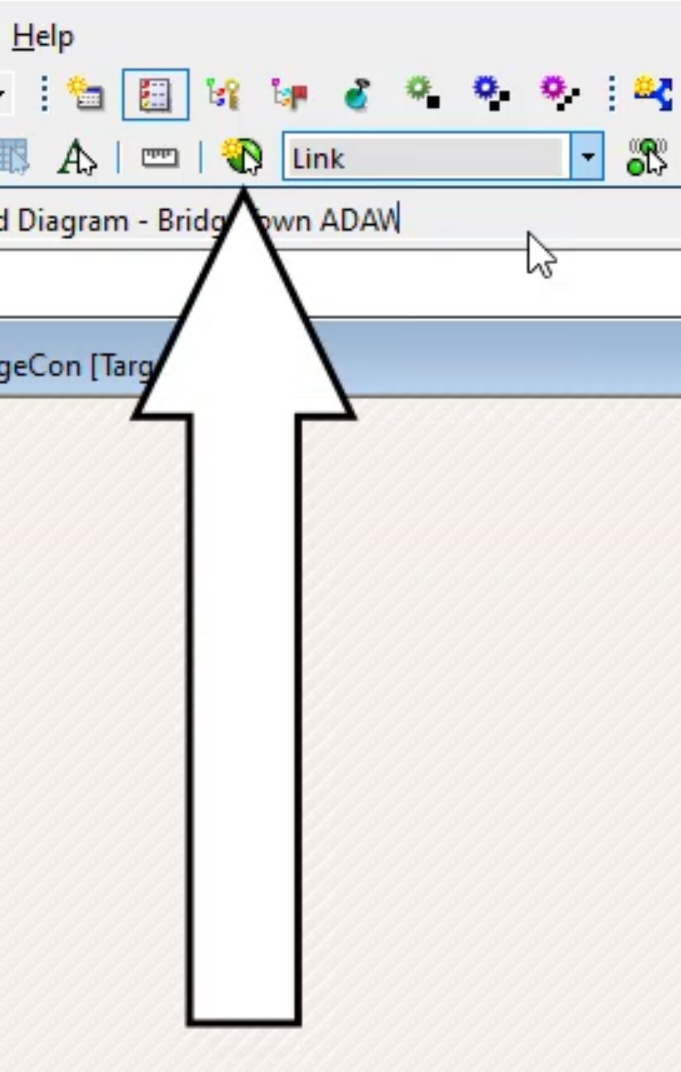
to fix the connection in the toolbar next to the new object button,
04:11
expand the dropdown and select link,
04:15
click the new object button,
04:17
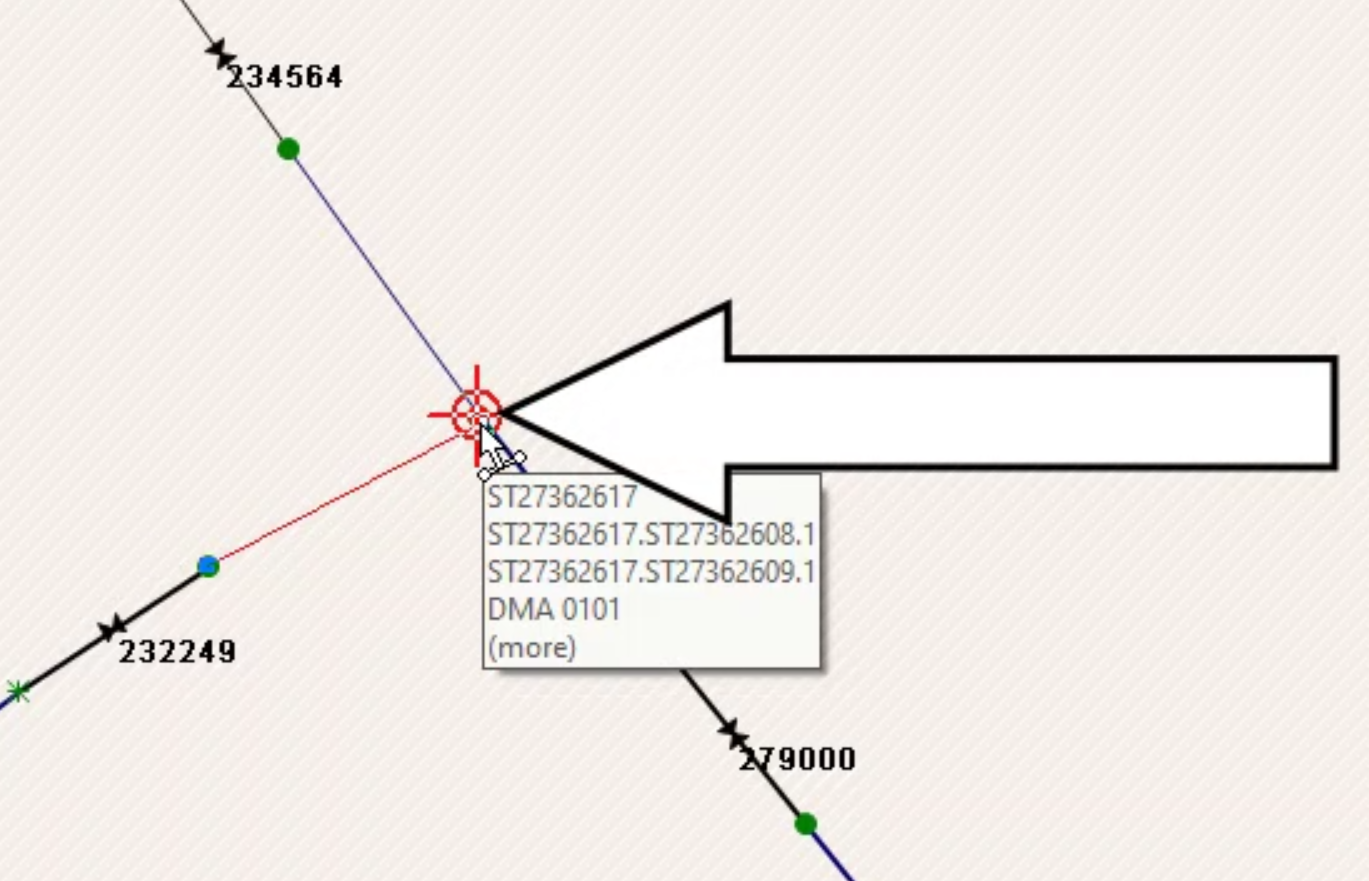
the cursor changes to indicate it is ready to create a new link.
04:22
Click the node at the end of the upstream portion of the network to
04:25
place a start point and then click again on the node across from it.
04:30
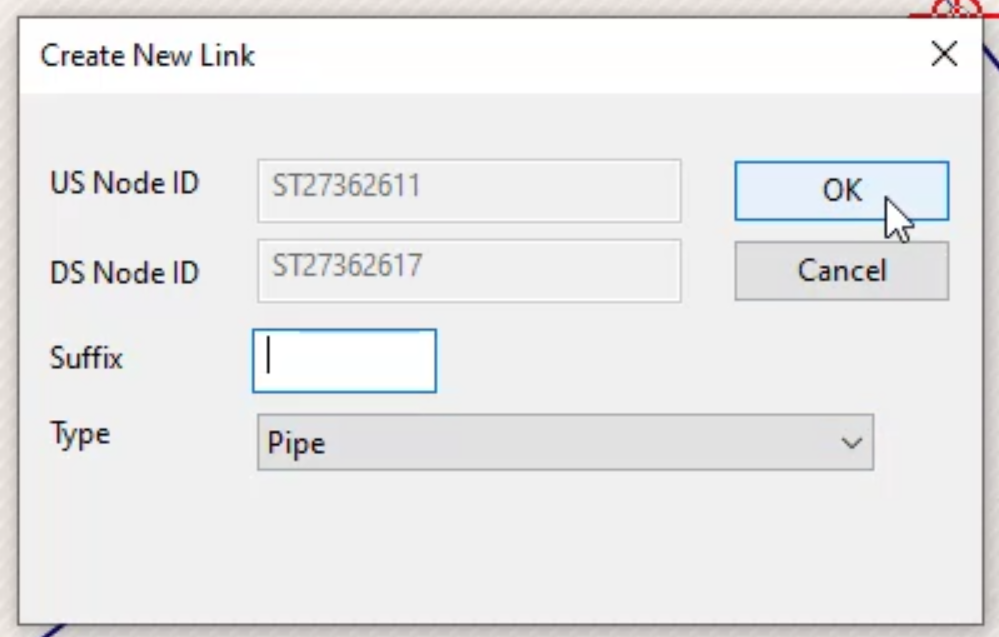
In the create new link dialog, expand the type dropdown and select pipe.
04:38
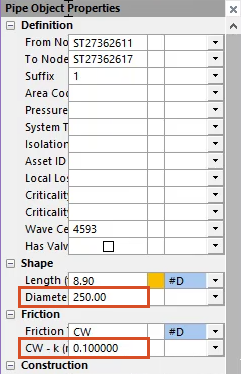
In the properties window,
04:39
you can see the properties for the new pipe you just created.
04:43
In this example, the small cells next to the diameter and CW
04:49
this means you are required to enter values for those properties,
04:53
set the diameter of the pipe by entering 250 in the diameter row.
04:59
Then enter a value of 0.1 in the C W K or friction coefficient field.
05:06
Close the property's window
05:09
validate the model again and click. OK. In the following dialogue.
05:14
Now the output window only lists three errors as the connectivity issue is solved.
05:20
Solving that issue also resolved the warning that had previously appeared here
05:25
in the output window.
05:26
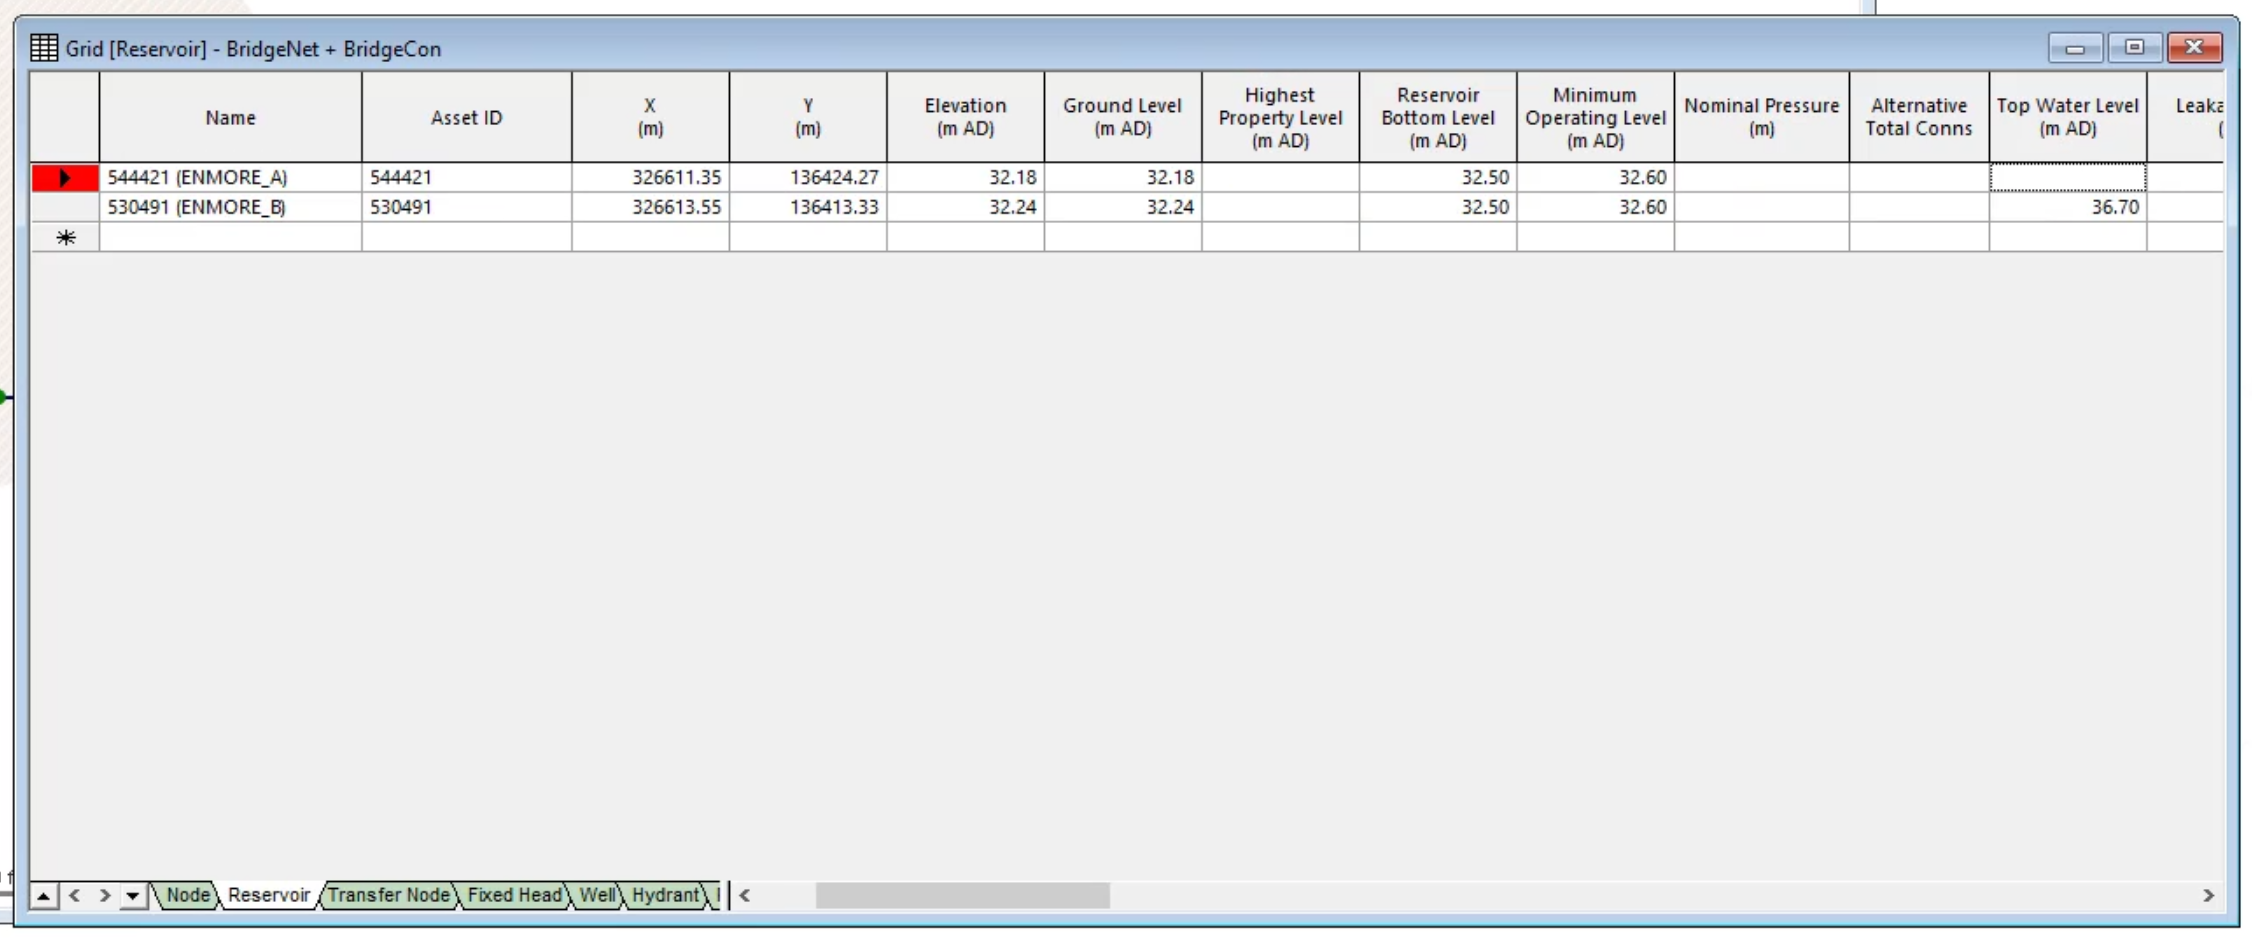
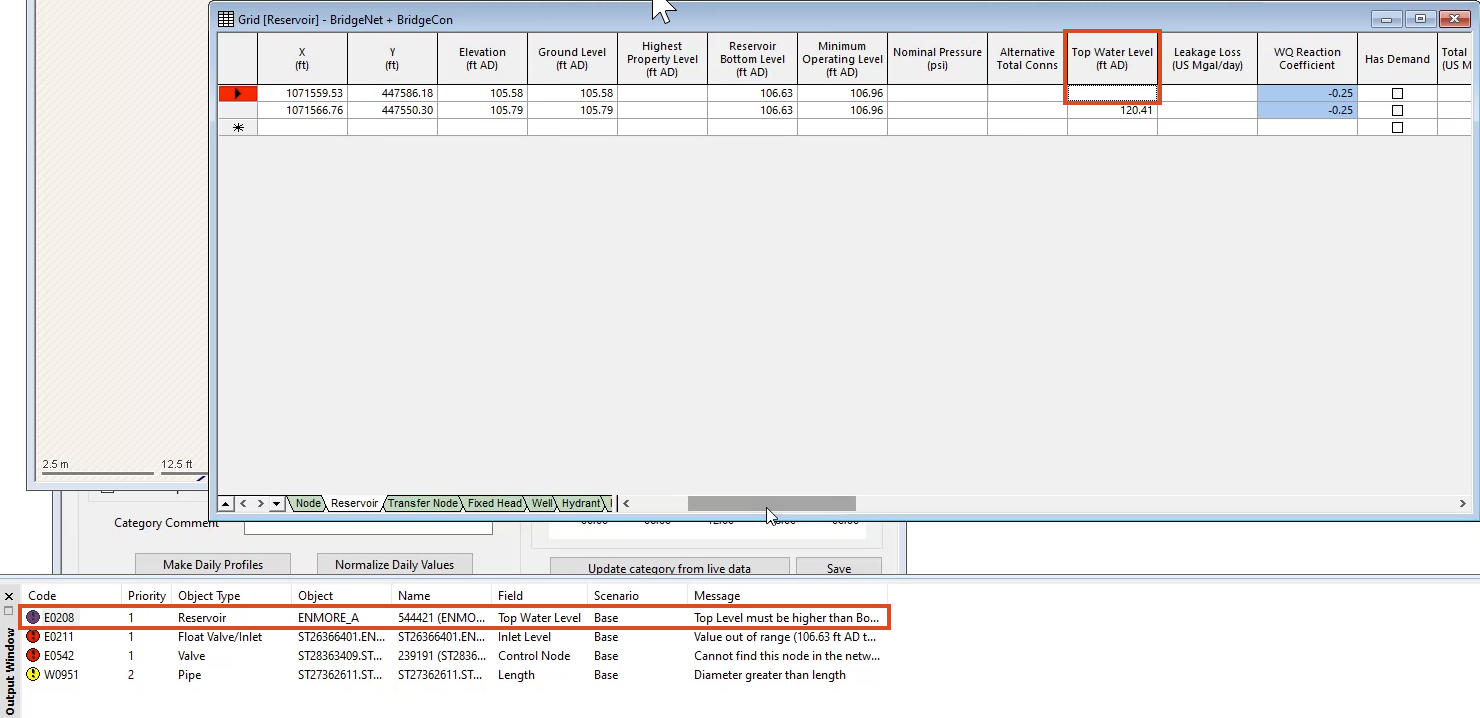
The reservoir error is now at the top of the list,
05:30
click and drag the edge of the window to expand it.
05:33
And you can see top water level listed in the field column,
05:37
double click the error to view its details in a grid.
05:41
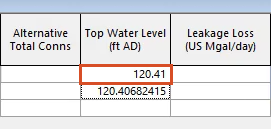
In the first row, you can see that the cell in the top water level column is blank.
05:46
This is a common error that often happens
05:48
when importing data from other sources such as GIS
05:53
click in the type Boxx and enter the same value listed below it.
05:59
Click in another cell to make sure the value you just entered is saved,
06:03
then close the window
06:05
validate the model again.
06:07
The output window now lists only one error again emphasizing
06:11
how fixing one error can sometimes automatically solve another.
06:15
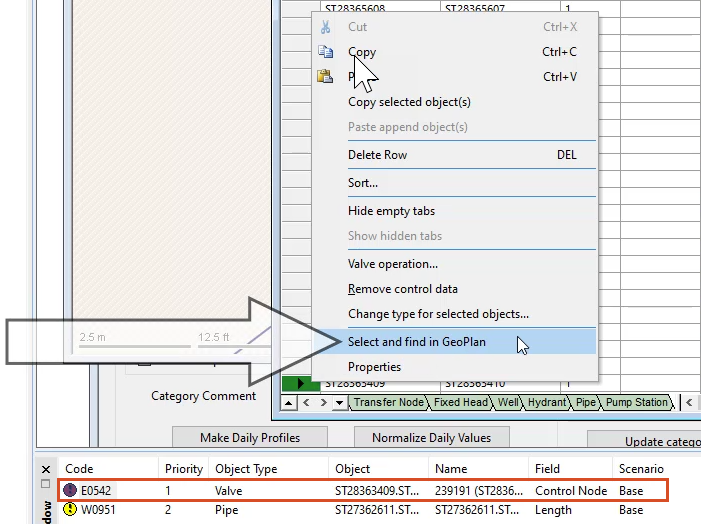
The final error is a control node problem in a valve,
06:19
double click the error to open a grid to see its details,
06:23
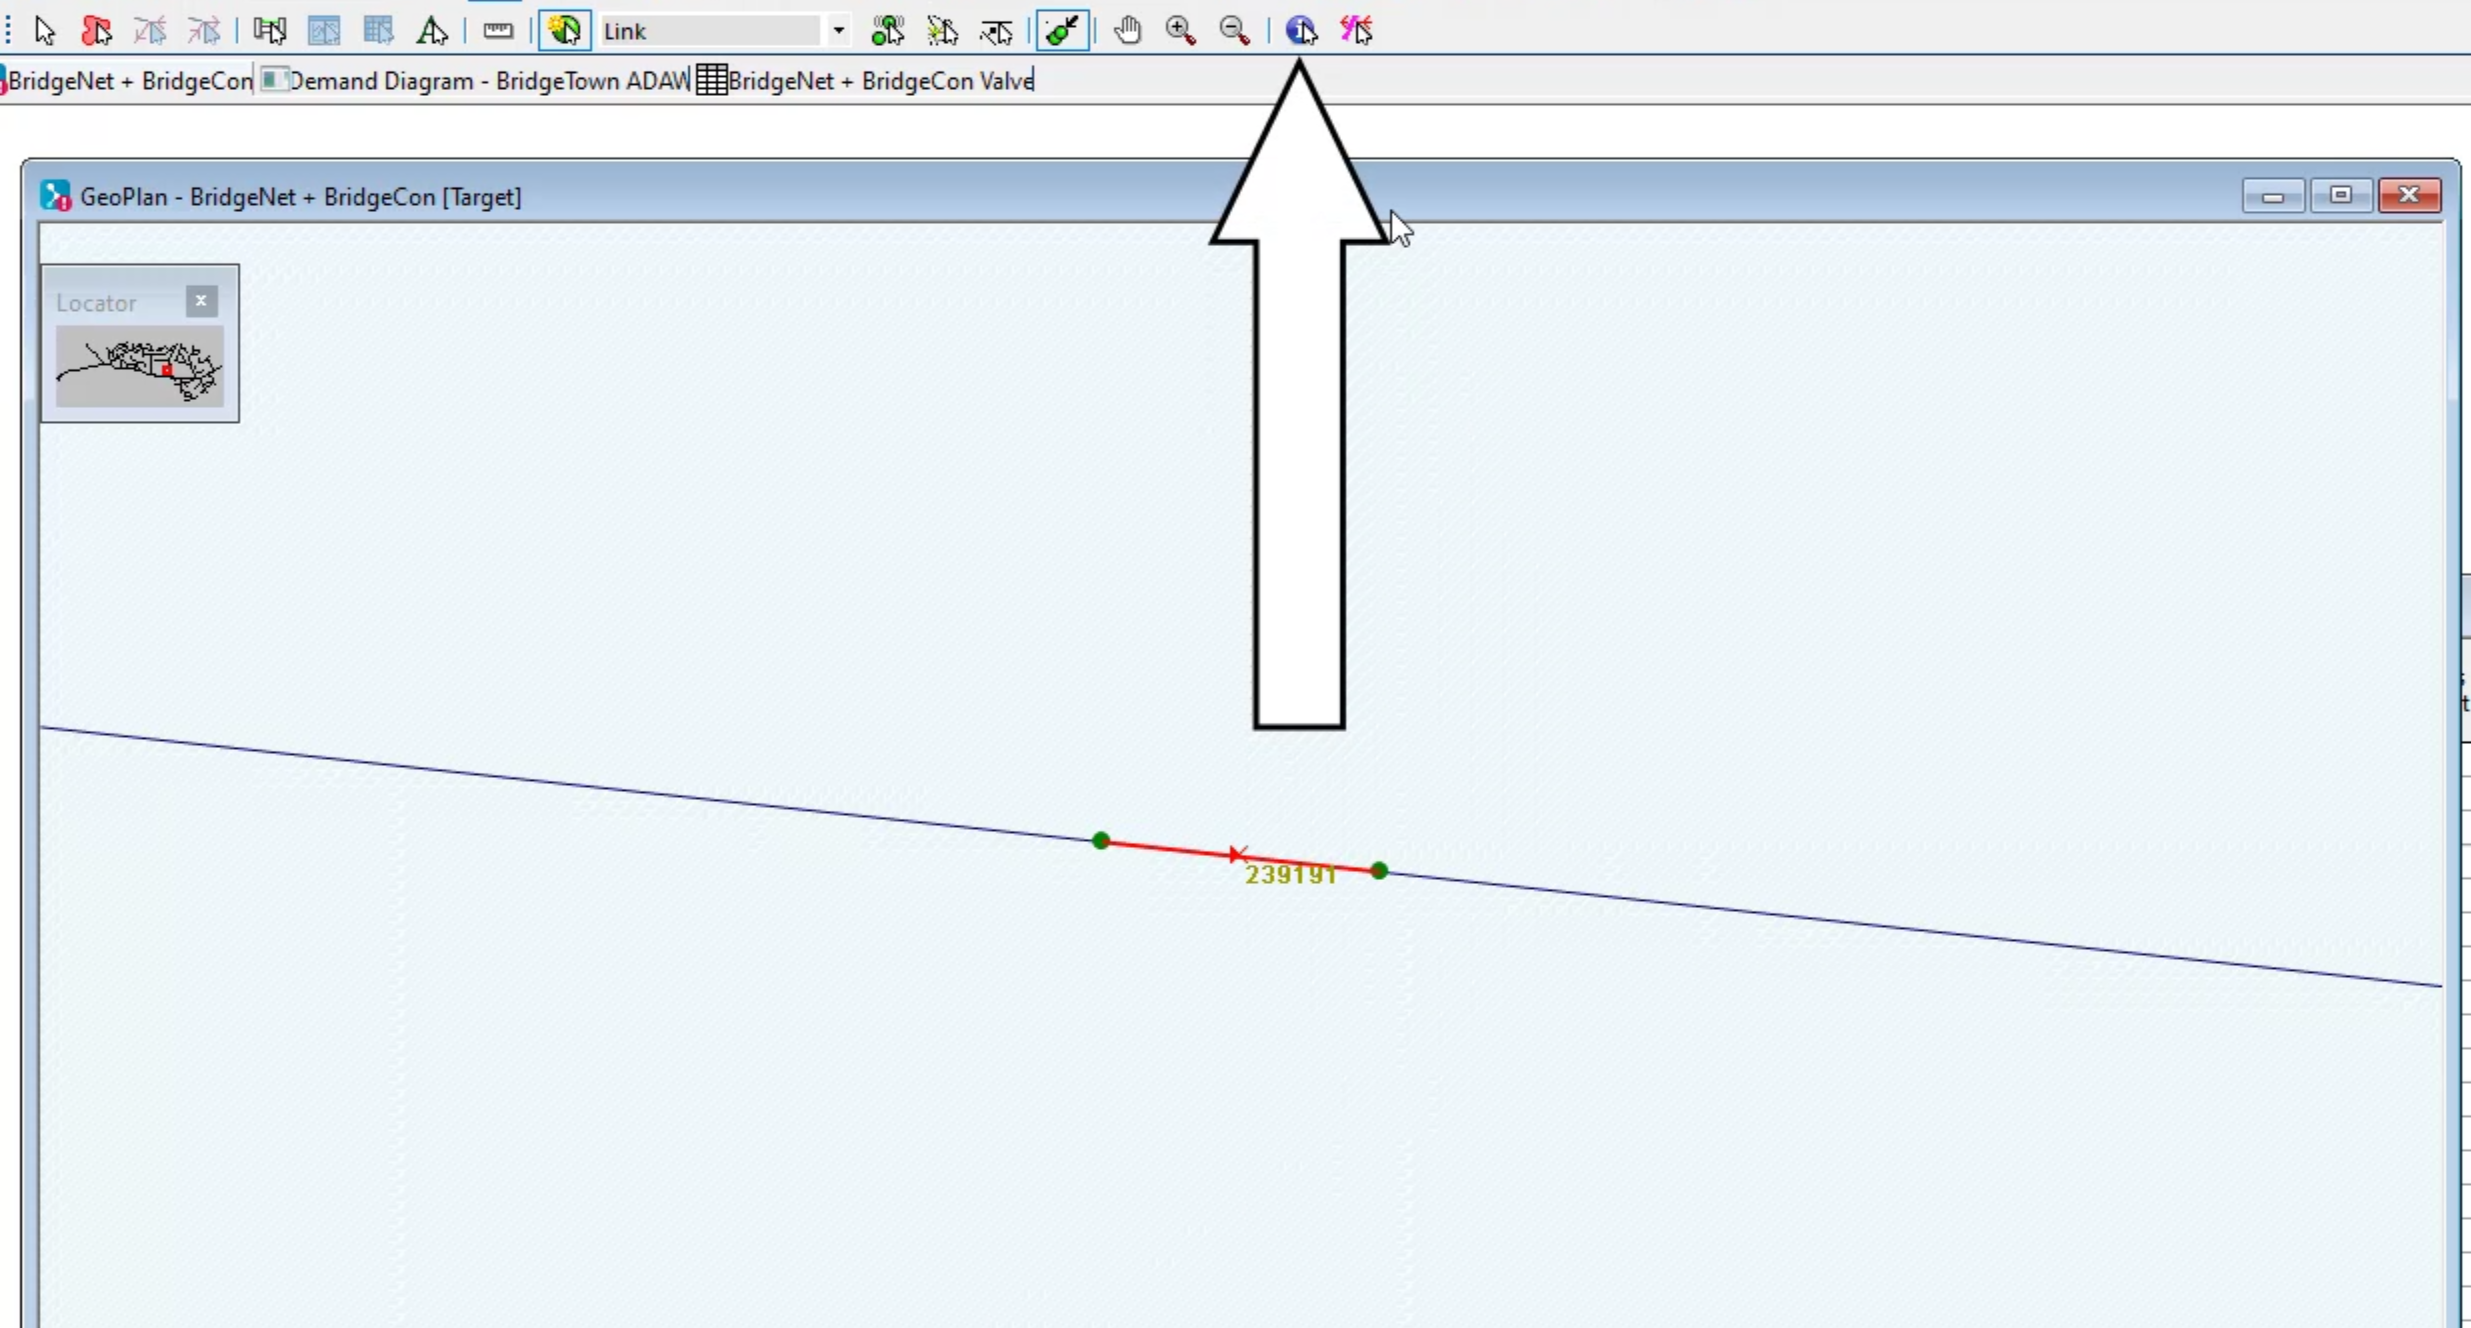
you can fix the error in the grid but it is sometimes easier to do so. In the GEO plan
06:29
at the bottom of the left column, click the green cell with the black arrow,
06:33
then click select and find in GEO plan.
06:37
This changes the window from a grid to a zoomed in
06:39
view of the GEO plan with the valve highlighted in red
06:45
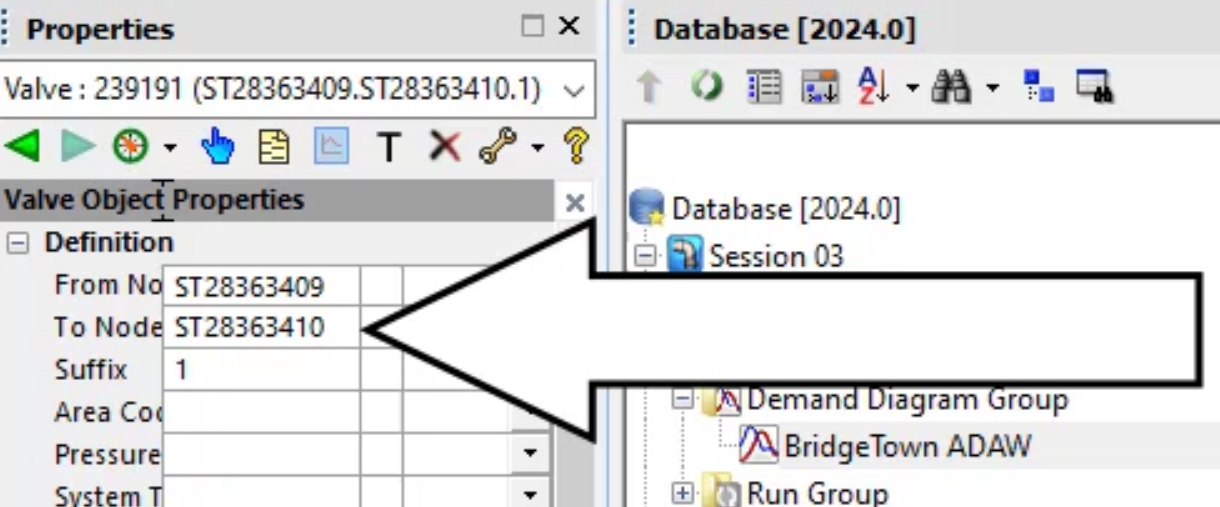
click the properties button and then click the valve to view its properties
06:50
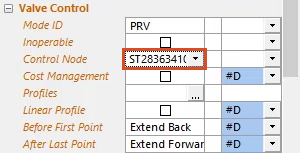
because this is a pressure reducing valve prv. It requires a control node.
06:55
In this example, the node immediately downstream will be used as the control
07:01
at the top of the property's window. Click the S T 28363410 node ID
07:07
copy it by pressing control C
07:09
and then paste it into the combo box in the control node row.
07:13
You can also expand the drop down to
07:15
scroll through a list of available control nodes.
07:18
But using the copy paste function simplifies the process
07:22
validate the model. Again,
07:24
the output window is now cleared of all errors and warnings.
07:27
Meaning that the model is now hydraulically sound
07:30
and ready to be run through simulations.