Step-by-step guide
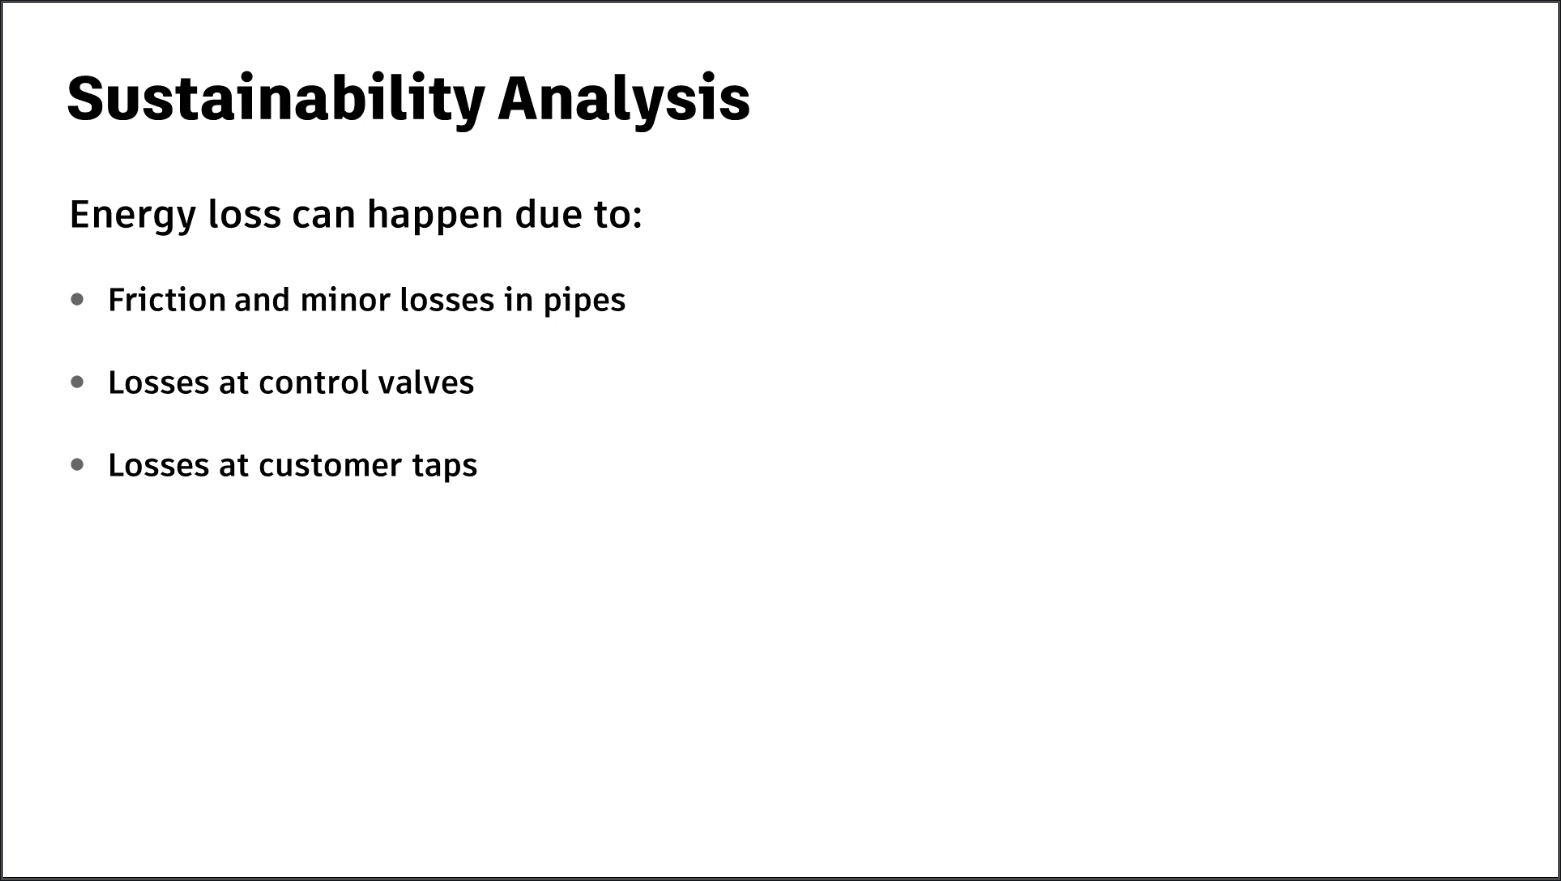
The sustainability analysis functionality in InfoWorks WS Pro allows energy losses in the network to be calculated as a Carbon Dioxide (CO2) equivalent. Energy loss can happen due to friction and minor losses in pipes, losses at control valves, and losses at customer taps. For pumping stations, a carbon dioxide equivalent of pump energy usage is also calculated. The results of the analysis can be used to review and manage energy losses through the network.
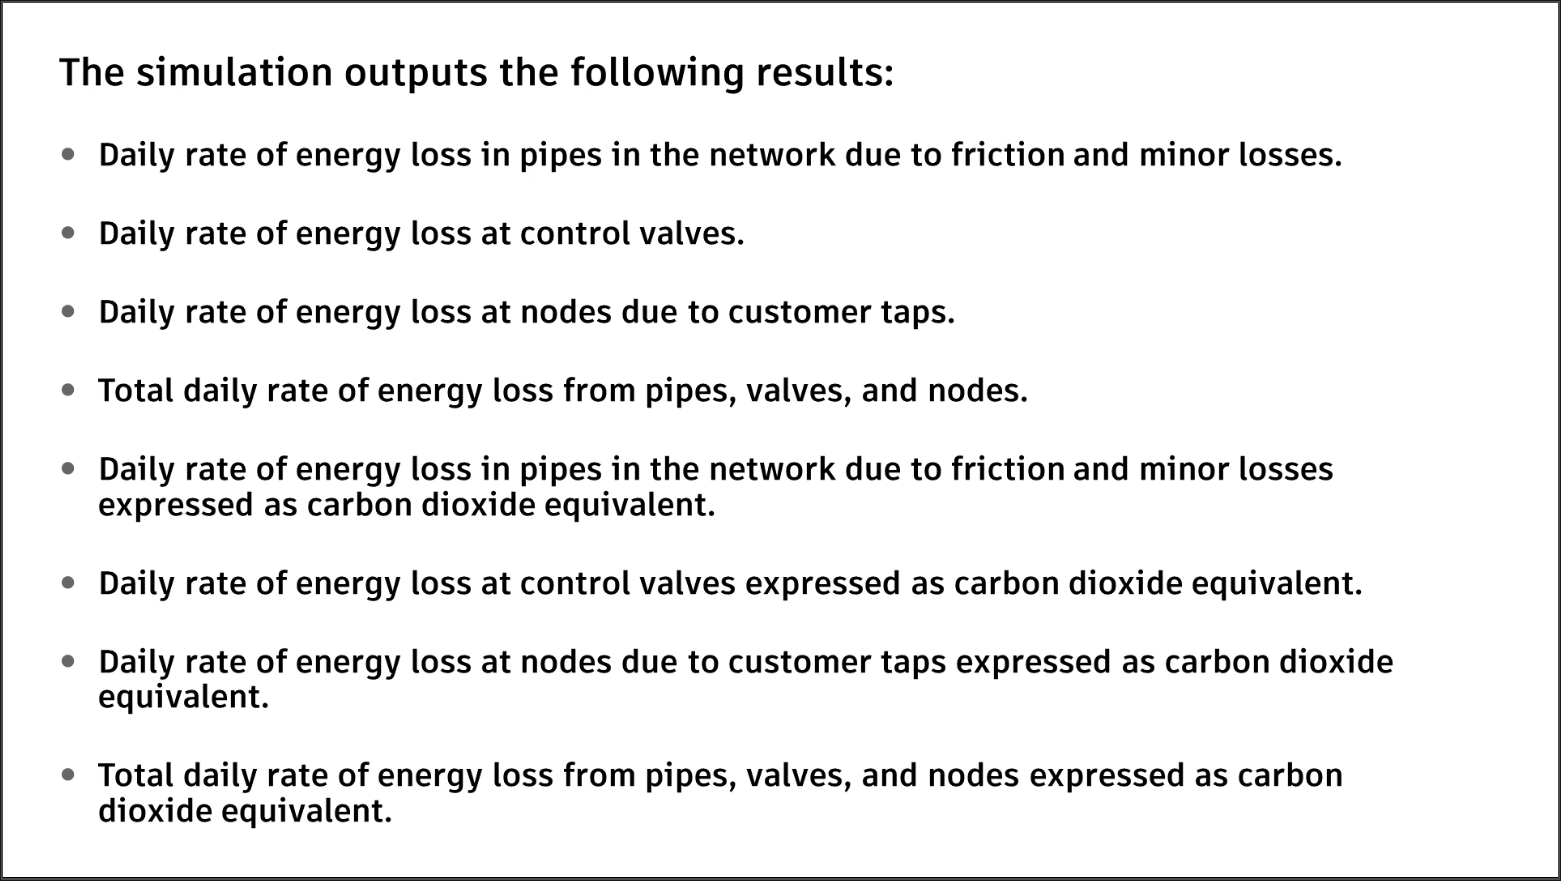
The simulation outputs the following results:
IMPORTANT: In order to carry out sustainability calculations, CO2 conversion factors need to be defined. Different conversion factor regimes can be set up for use in calculating network losses, or for use with different pumping stations.
To run a sustainability analysis, set up the appropriate CO2 configuration for the model:
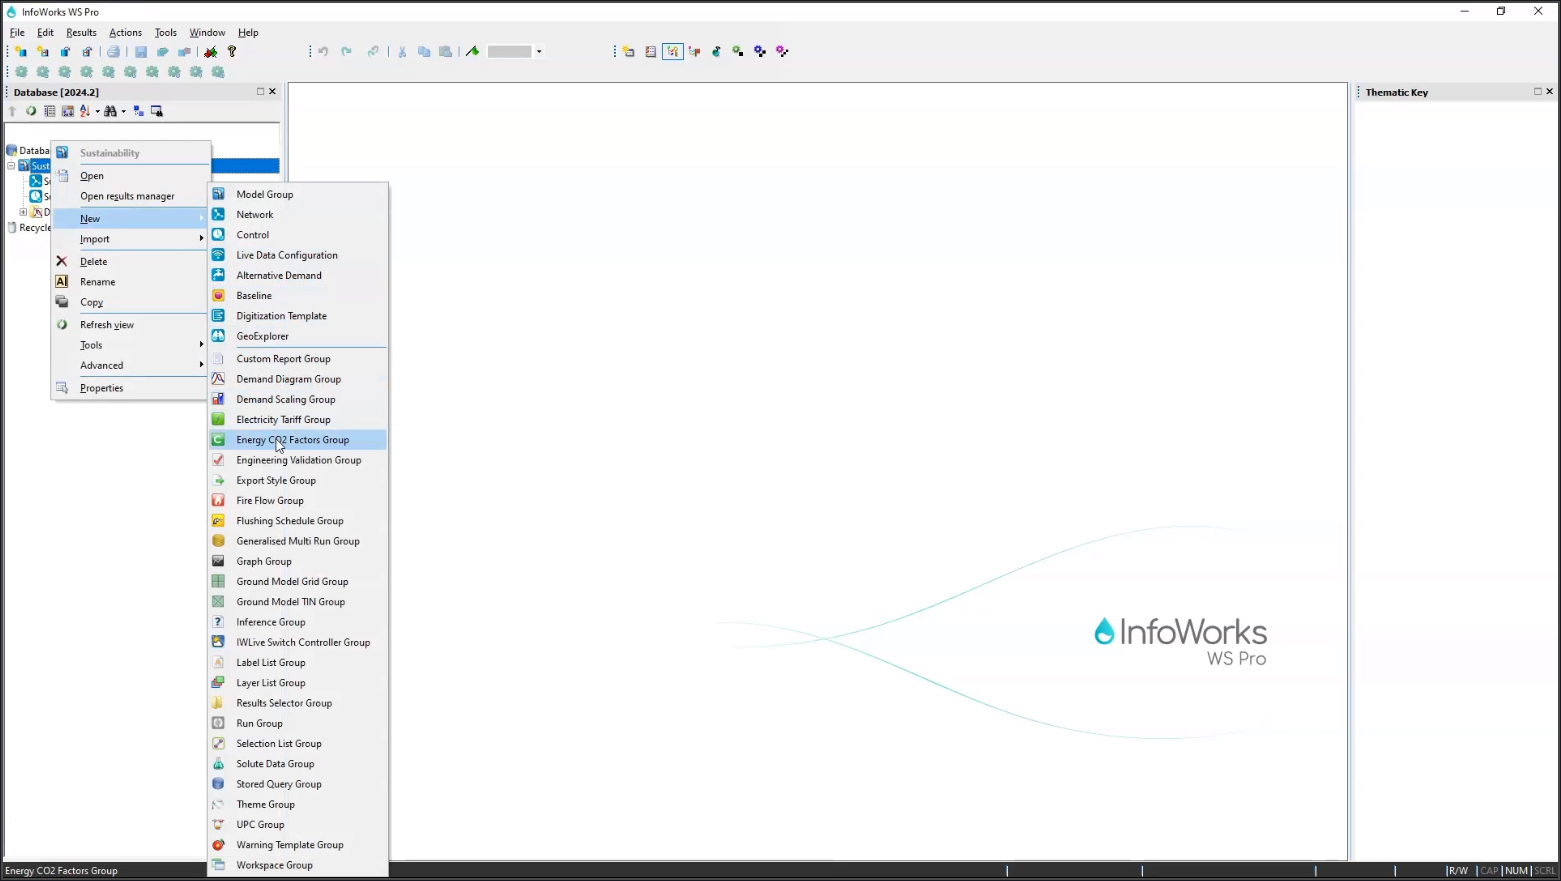
- From the Model Group window, expand the Sustainability node.
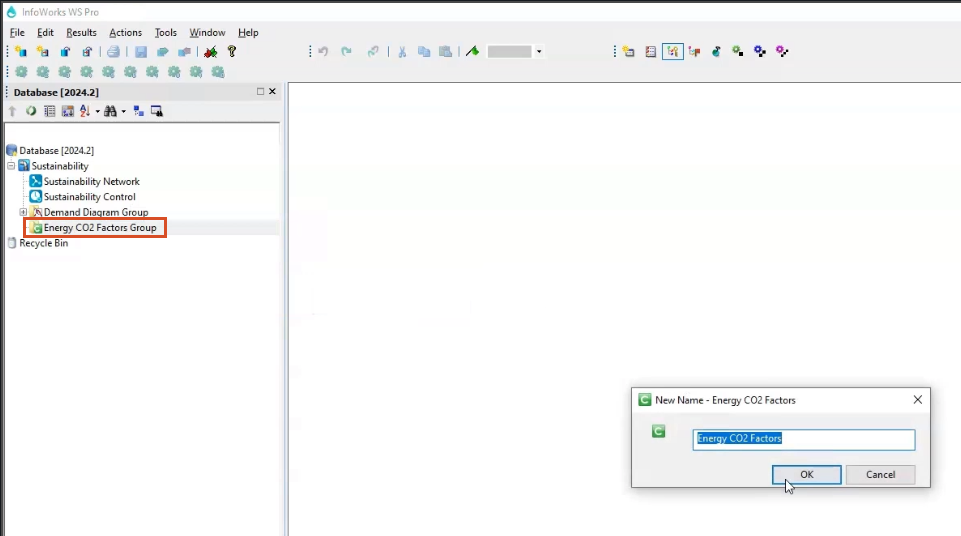
- Right-click the Sustainability model group and select New > Energy CO2 Factors Group.
- In the New Name popup, accept the default name and click OK.
- Right-click Energy CO2 Factors Group and select New > Energy CO2 Factors.
- In the New Name popup, accept the default name and click OK.
To configure the energy factors:
- Double-click Energy CO2 Factors.
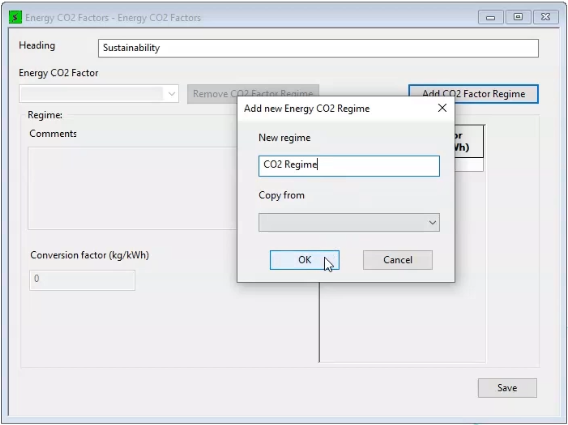
- In the Energy CO2 Factors dialog box, type a name for the Heading. For this example, enter “Sustainability”.
- Click Add CO2 Factor Regime.
- In the Add new Energy CO2Regime pop-up, add a new regime name. For this example, type, “CO2 Regime”.
- Click OK.
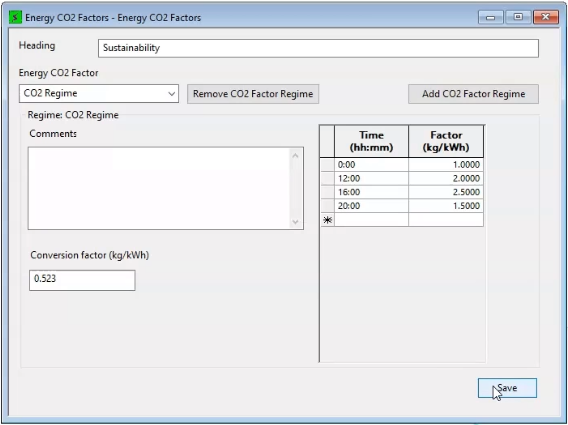
The new regime appears under the Energy CO2 Factor drop-down.
On the right side of the Energy CO2 Factors dialog box, enter the following Time and Factors:
- 1 kg/kWh at 00:00 midnight.
- 2 kg/kWh at 12:00 noon.
- 2.5 kg/kWh at 16:00.
- 1.5 kg/kWh at 20:00.
- Click Save.
- Close the Energy CO2 Factors dialog box.
To run the sustainability simulation:
- Right-click Sustainability and select New > Run Group.
- Right-click the Run Group, then select New > Run.
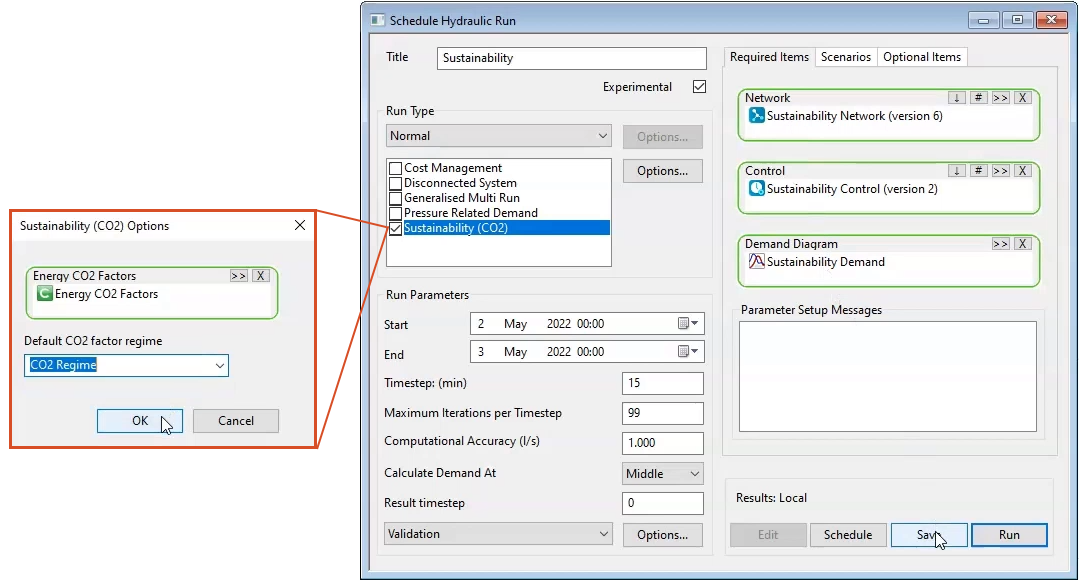
- In the Schedule Hydraulic Run dialog box, type “Sustainability” as the name for the run.
- Enable Experimental.
- Expand the Run Type drop-down and select Normal.
- Enable Sustainability (CO2).
- From the Model Group, drag the new Energy CO2 Factors object and drop it into the Energy CO2 Factors box in the Sustainability (CO2) Options popup.
- Expand the default CO2 Factor Regime drop-down and select CO2 Regime.
- From the Model Group, drag the Sustainability network and drop it into the Network box in the dialog box to populate the Network, Control, and Demand Diagram boxes.
- Click Save.
- Click Run.
To view the results:
- Double-click the Sustainability Control simulation.
- Expand the Results menu and select Grid Reports > Flow, system and global summary results.
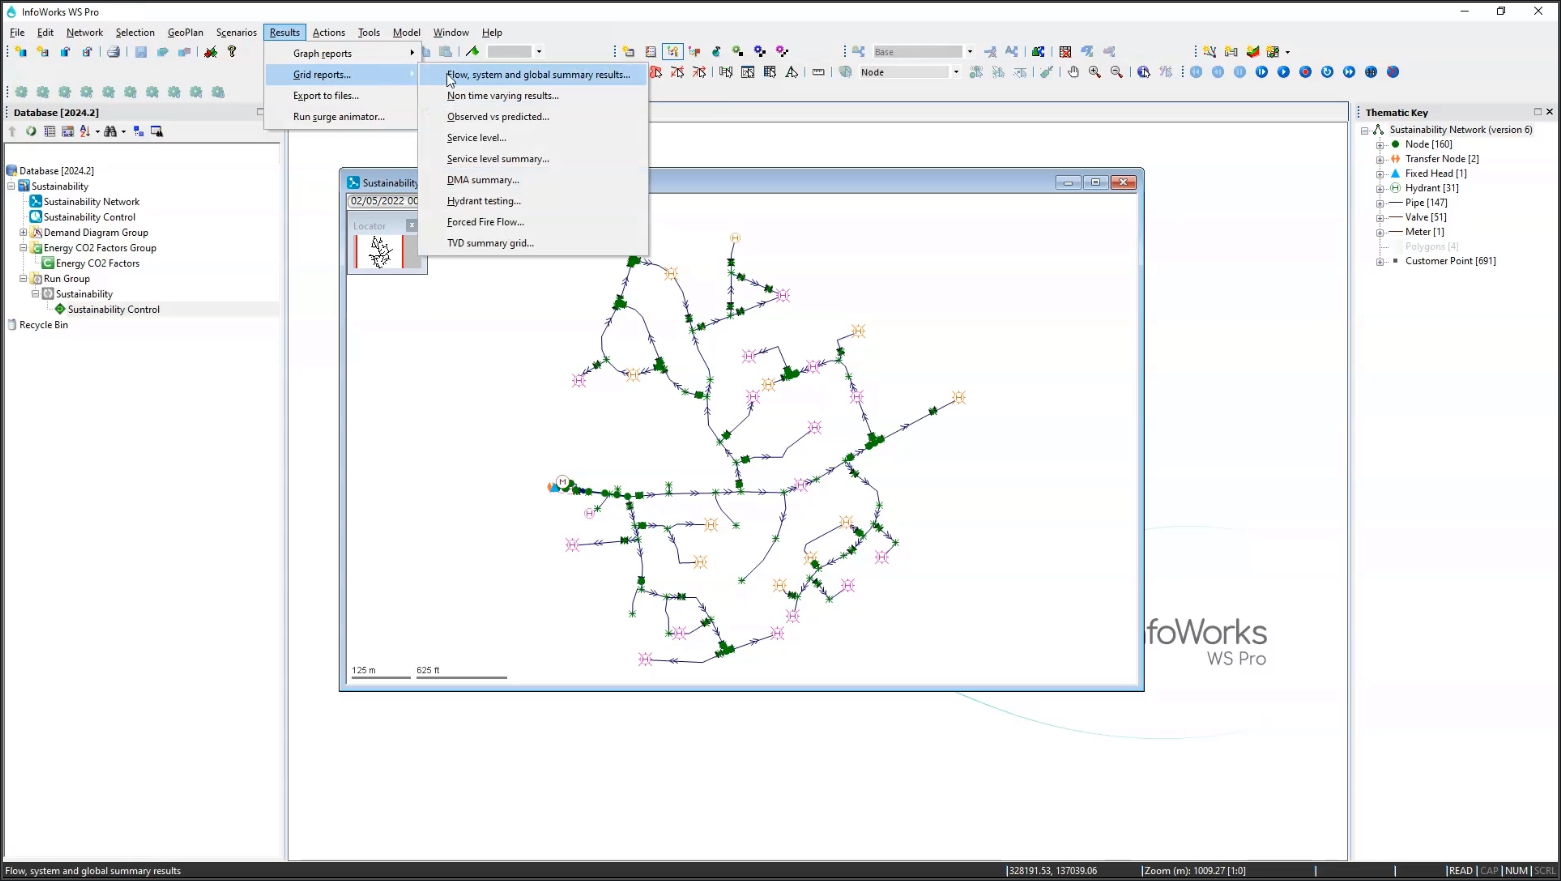
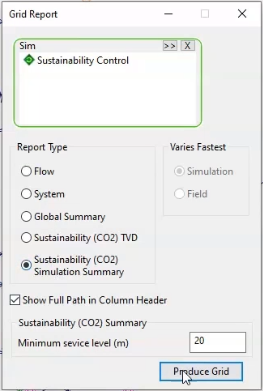
- The Grid Report Window opens. If the Sustainability Control simulation has not auto-populated in the Sim box, drag and drop it from the Model Group.
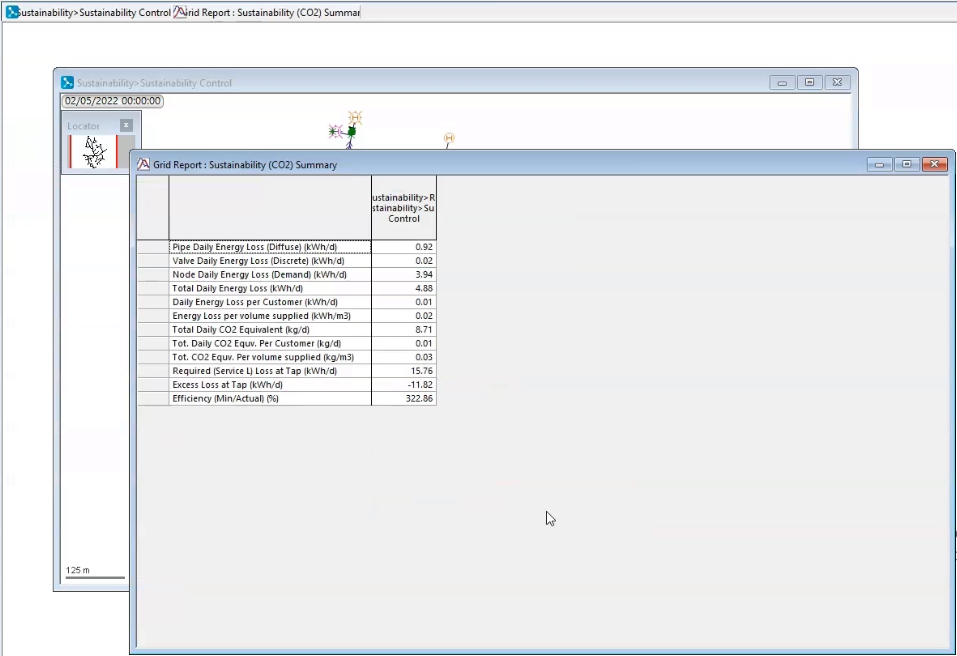
- In the Report Type group box, select Sustainability (CO2) Simulation Summary.
- Click Produce Grid.
- In the Sustainability Summary grid report, review the various CO2 output and statistics from across the simulation.