& Construction

Integrated BIM tools, including Revit, AutoCAD, and Civil 3D
& Manufacturing

Professional CAD/CAM tools built on Inventor and AutoCAD
Once a connection is established between live data and a network, the data can be used to perform a run, and the results can be graphed to see how the system performed in real-time.
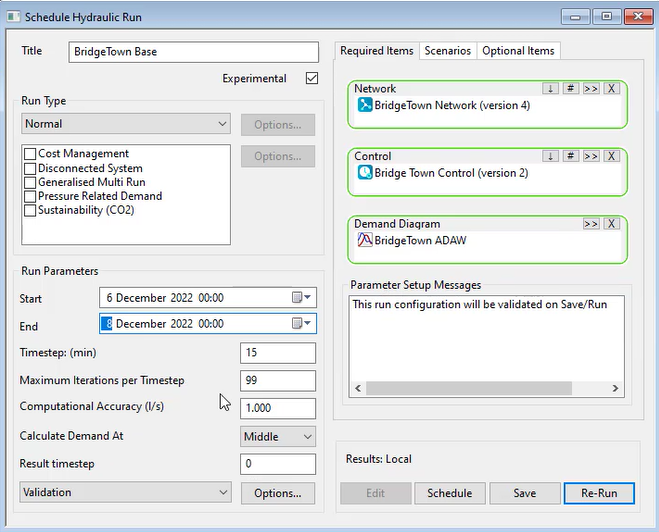
To perform a run with live data points in a network:

These dates match those in the live data files connected to the network.
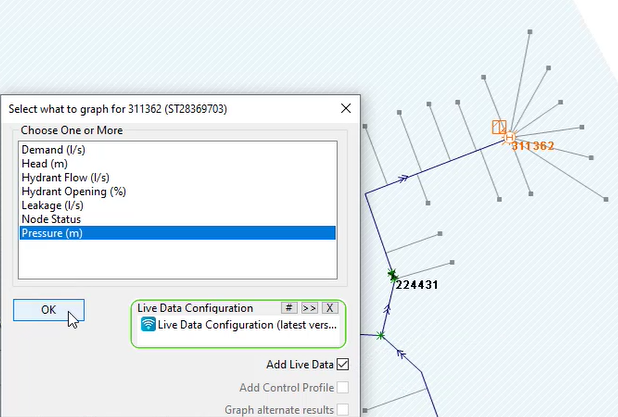
To graph the results:

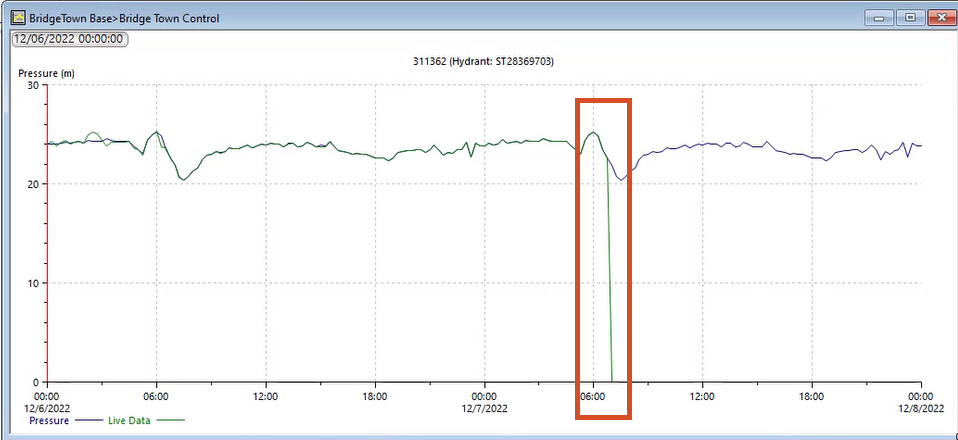
A graph opens, showing the pressure as a blue line and the live data as a green line. There is a pressure drop in the live data around 7 a.m. If the time you run the model for exceeds the time of the live data, the live data would simply stop at that point. However, in this example, the live data shows the pressure dropping to 0. That means that somewhere in the live data files or through your telemetry system, something has happened in the network to cause a drop in pressure. For example, a burst pipe or telemetry system drop-off may have occurred.
