Step-by-step Guide
InfoWorks WS Pro allows users to export both time varying data (TVD) and summary data.
Time Varying Data, like pressure or flow, changes at each timestep of the simulation.
- Create a new folder with the name “Results” to store the results of this exercise.
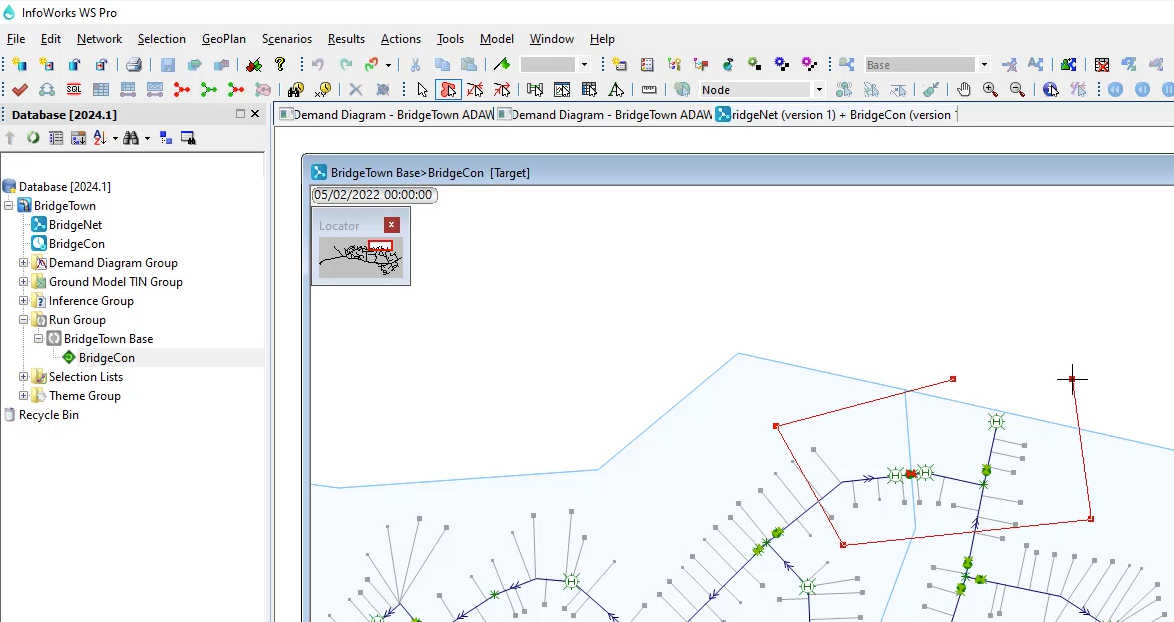
- From the Model Group window, drag-and-drop a completed run with results into the workspace to open the simulation GeoPlan.
- Zoom into a part of the network populated with nodes.
In this case, several hydrants are nearby.
- In the Tools toolbar, click the Polygon select tool.
- Click repeatedly to draw a polygon around several nodes.
Note: The more points you select, the longer the export process will take.
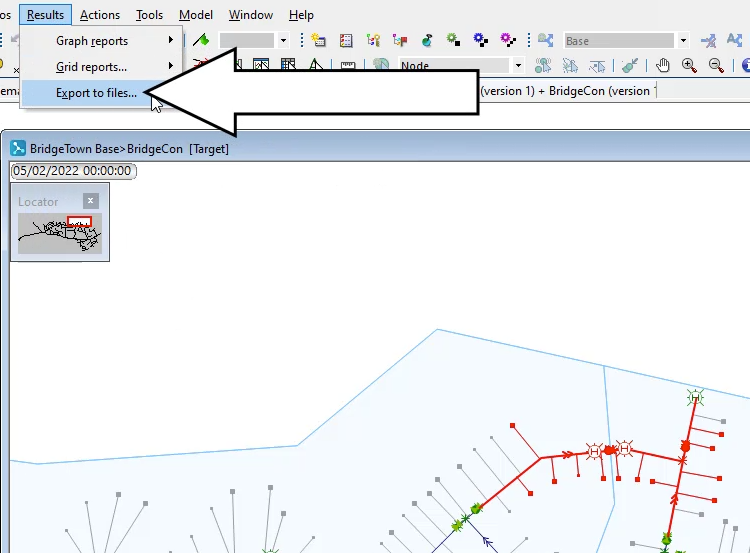
- From the Results menu, click Export to files.
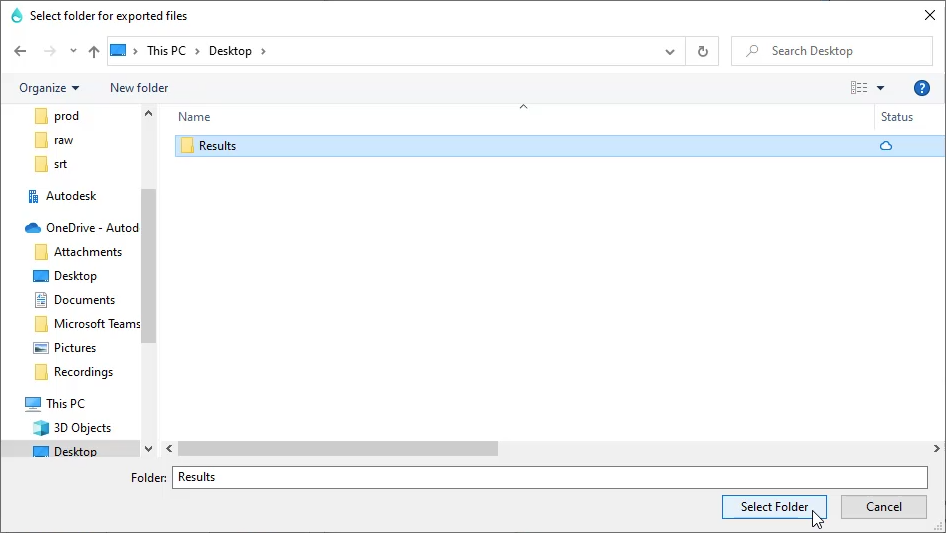
- In the Export Results Data Files dialog box, next to the Folder for output files field, click the Browse (…) button.
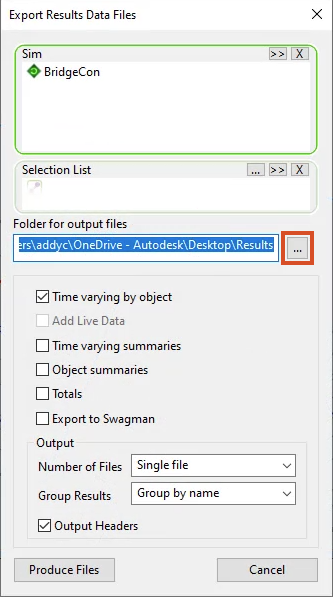
- In the file browser, navigate to the folder created in Step 1; in this case, This PC > Desktop > Results.
- Click Select Folder.
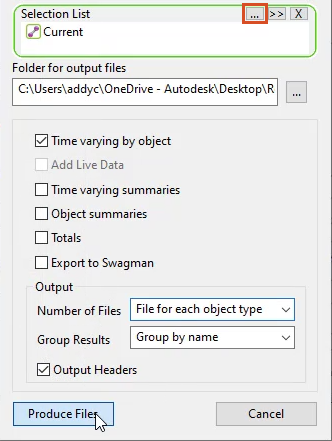
- In the Export Results Data Files dialog box, Selection List box, click the Current (…) button to use the currently selected group of objects.
Important: If you skip Step 10, the results for every object in the model will be exported, which may take a long time.
- In the Output group box, expand the Number of Files drop-down and select File for each object type.
- Expand Group results and select Group by name.
- Click Produce Files.
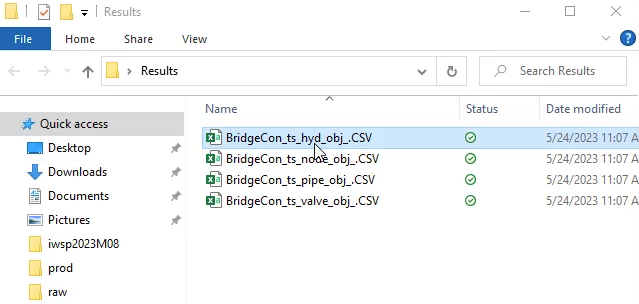
- Open the file browser and navigate to the Results folder created in Step 1.
Notice there are now several CSV files, one for each type of object selected in the polygon.
- For this example, select BridgeCon_ts_hyd_obj_.CSV, the file for hydrants.
- Open the file in a spreadsheet application.
- Expand the first column, if needed.
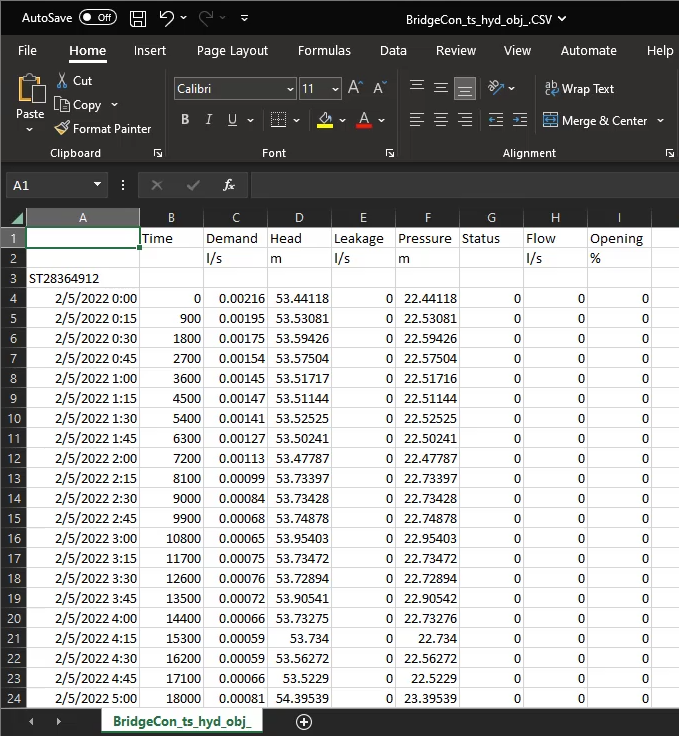
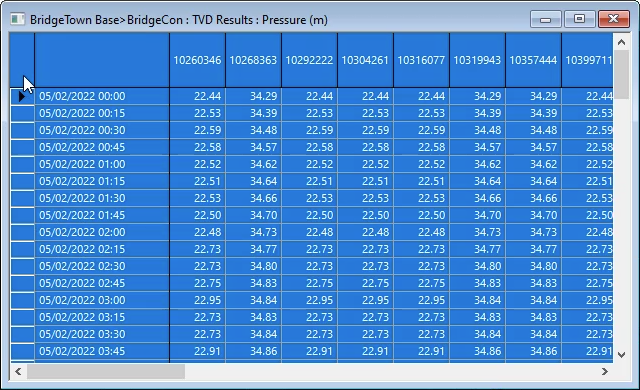
The data is arranged with each object ID acting as a header, with the time varying results below it.
To export the results in a more spreadsheet-friendly format:
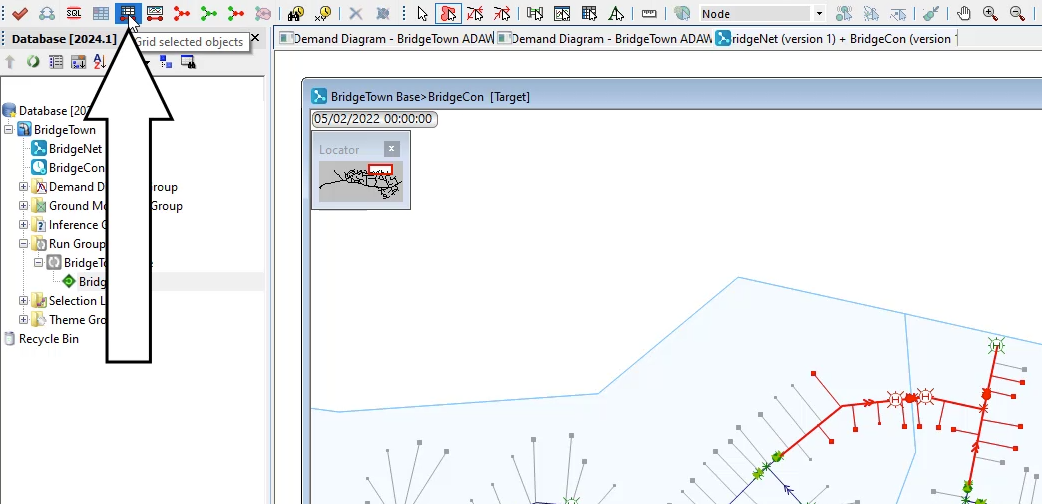
- With the objects still selected in the GeoPlan, in the Operations toolbar, click the Grid selected objects button.
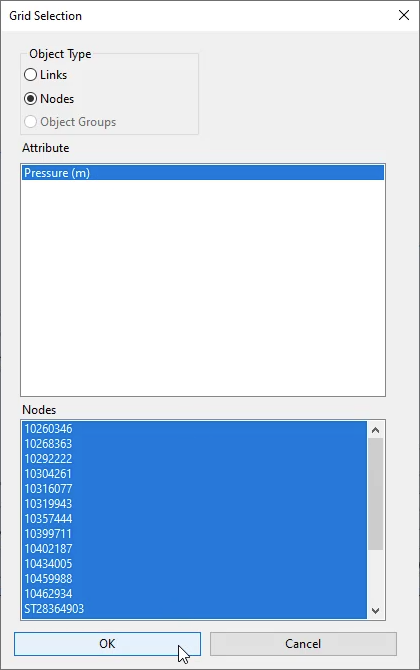
- In the Grid Selection dialog box, in the Object Type group box, enable Nodes.
- In the Attribute list, select Pressure (m).
- Click OK to open a grid with the timeseries data.
To easily transfer the contents of the grid to a spreadsheet:
- Click the top-left cell to select all the data.
- On your keyboard, press CTRL+C.
- Press CTRL+V to paste the data into a blank spreadsheet.