Step-by-step Guide
Categorizing demand in InfoWorks WS Pro allows you to easily visualize different demand profiles, which can be crucial for planning new developments. In this example, you will create a new demand category representing a school within a planned housing development.
- Copy Session 5.wspt into your Database.
- From the Model Group window, drag-and-drop BridgeNet into the workspace to open the GeoPlan.
- In the Scenarios toolbar, expand the Select scenario drop-down.
- Select the new scenario, Housing Development, which has a new node with allocated demand linked to the existing network.
To create a new demand category:
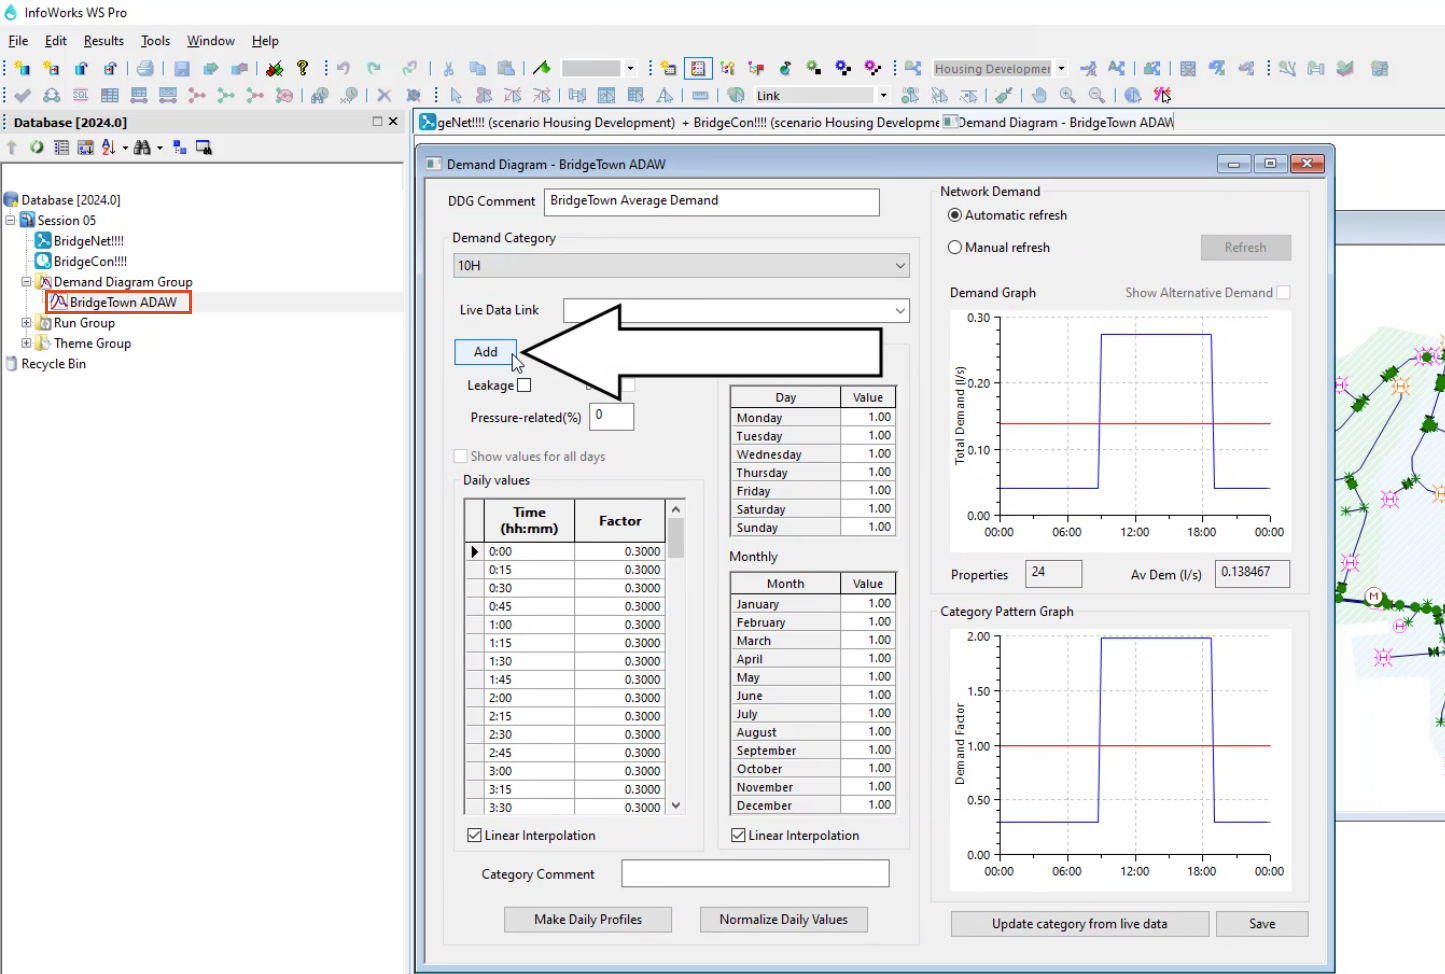
- From the Model Group window, under Demand Diagram Group, select BridgeTown ADAW.
- In the Demand Diagram window, click Add.
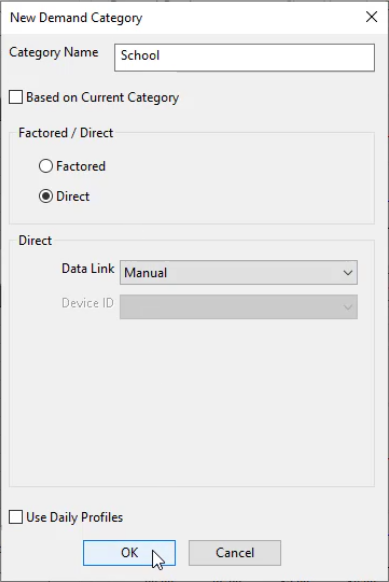
- In the New Demand Category dialog box, in the Category Name field, enter the name “School”.
- Under Factored / Direct section, select Direct, to use demand data from a live data source.
- Ensure the Data Link is set to Manual.
Note: This setting allows you to enter category data in the Demand Diagram editor manually.
- Click OK.
The Demand Diagram opens again with the Demand Category set to the newly created category, School.

To manually enter the data for the new demand category:
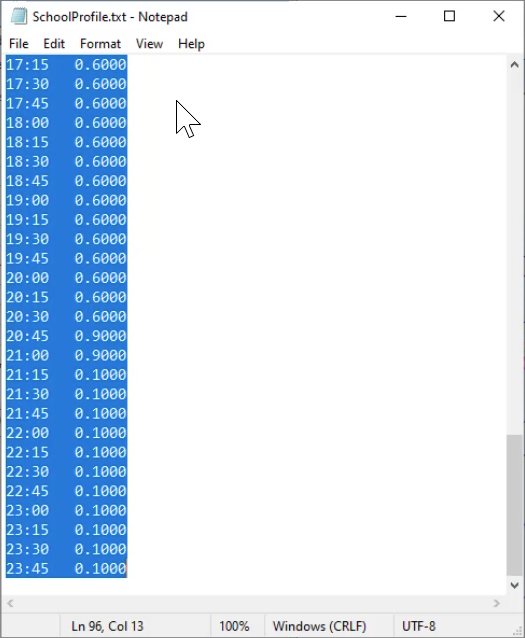
- From your device’s file explorer, open the file txt.
Note: The data in this document represents a demand pattern for a 24-hour period.
- From the document, select all data.
- Copy the data.
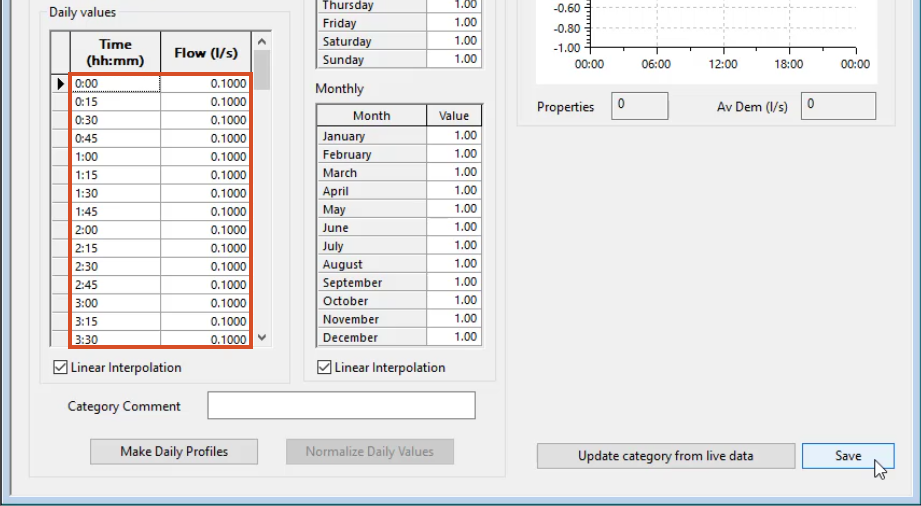
- In the InfoWorks WS Pro Demand Diagram, under Daily Values, select the top-left cell.
- Paste the data into the cell.
- Click Save.
To use the new demand category:
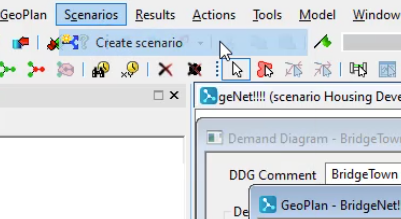
- In the ribbon, select Scenario > Create scenario.
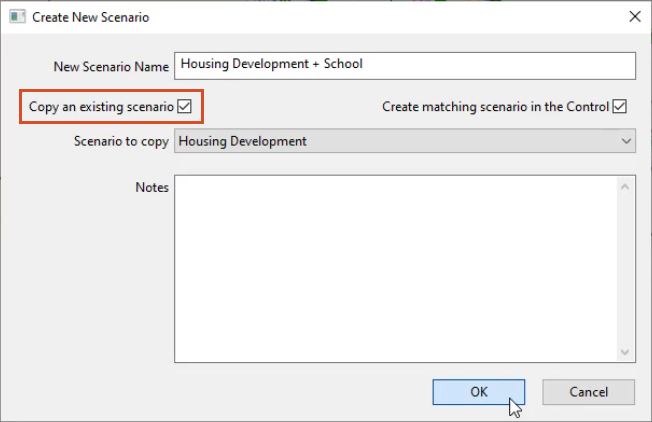
- In the Create New Scenario dialog box, enter the name “Housing development + school”.
- Select Copy an existing scenario.
- In the Scenario to copy drop-down, ensure that Housing development is selected.
- Click OK.
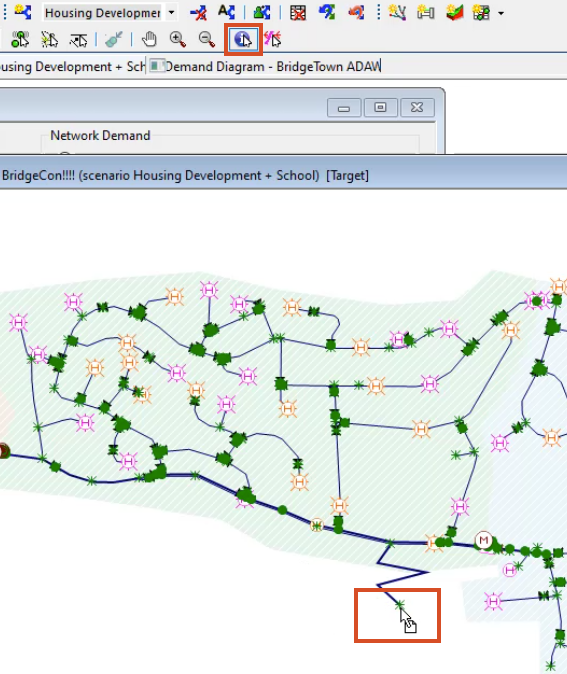
- In the Tools toolbar, select Properties.
- In the GeoPlan, select the node that represents the planned development.
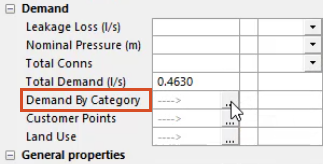
- From the Properties window, Demand section, in the Demand By Category field, click More (…).
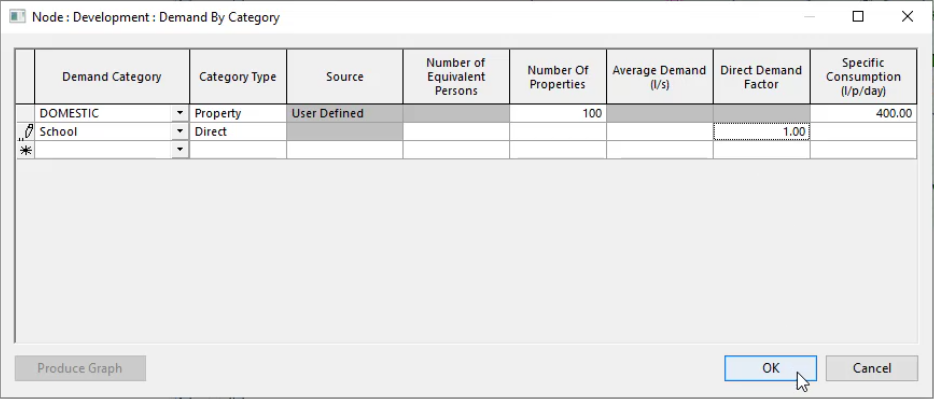
- In the Demand By Category dialog box, second row, expand the Demand Category drop-down and select School.
- Under Category Type, select Direct.
- In the Direct Demand Factor cell, enter “1” (so that it is not given a multiplier).
- Click OK.
- Commit the changes to both the BridgeNet network and the BridgeCon
To create a new run to simulate all three scenarios in the model:
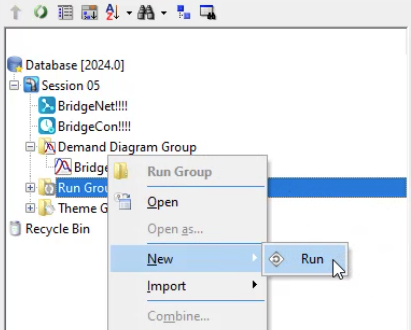
- From the Model Group window, right-click Run Group and select New > Run.
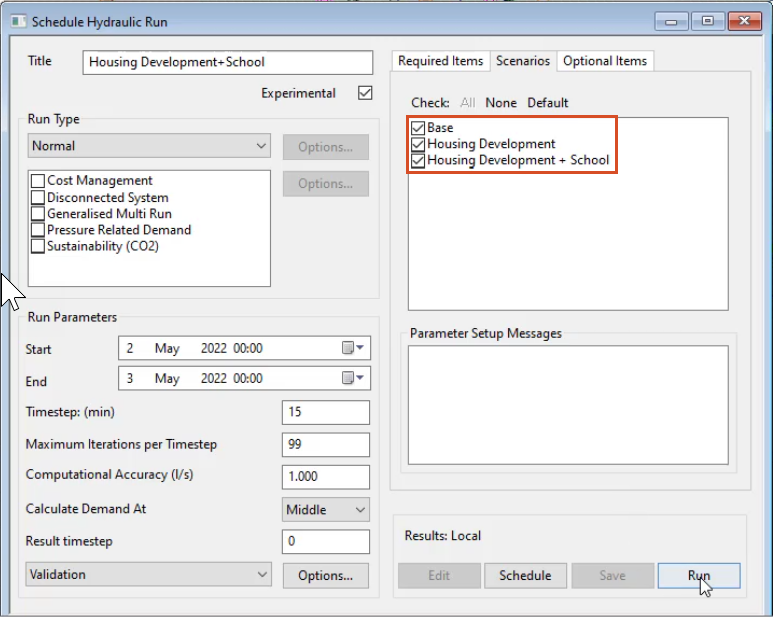
- In the Schedule Hydraulic Run dialog box, name the run “Housing Development + School”.
- Select Experimental.
- From the Model Group window, drag the BridgeNet network into the Schedule Hydraulic Run dialog box and drop it in the Network section.
- From the Scenarios tab, select all three scenarios.
- Click Run.
- In the warning dialog box, click Yes.
- In the Model Group window, expand the file tree, if needed, to display the new run.
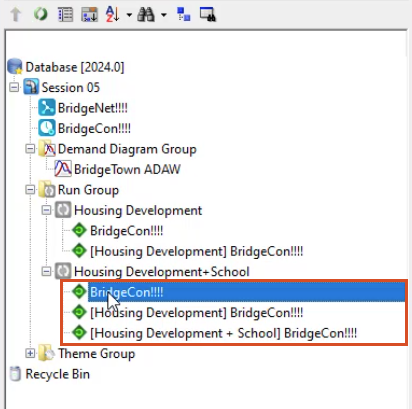
To open the three simulations for comparison:
- From the Model Group window, Run Group, under Housing Development + School, drag-and-drop BridgeCon into the workspace to open the base scenario simulation.
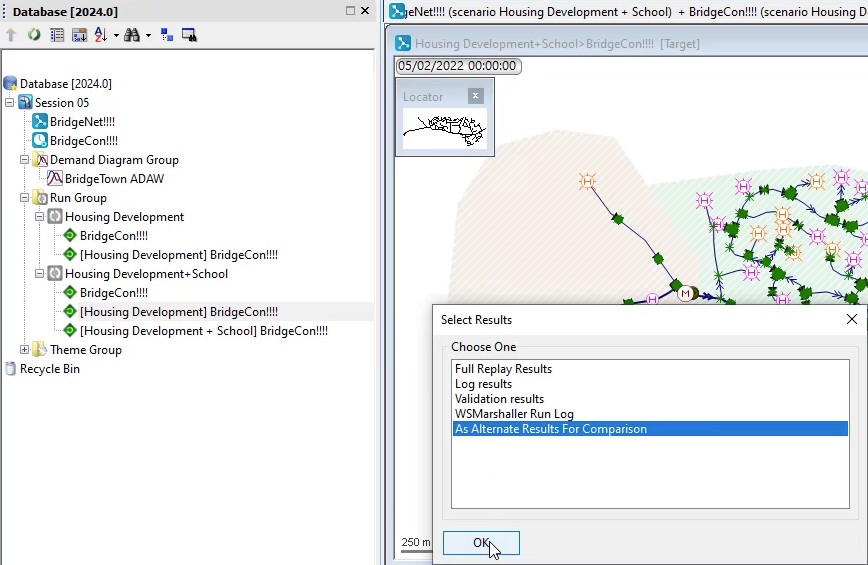
- Right-click the Housing Development simulation and select Open as.
- In the Select Results dialog box, select As Alternate Results For Comparison.
- Click OK.
- Repeat steps 39-41 for the Housing Development + School scenario.
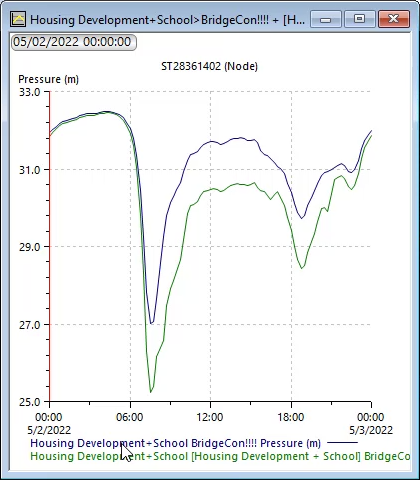
To graph the differences in pressure for the simulations:
- In the Tools toolbar, select Graph.
- On the GeoPlan, select the development node.
- In the Select what to graph dialog box, select Pressure (psi).
- Select Graph alternate results.
- Click OK.