Step-by-step guide
A prerequisite for network model calibration is that overall flow balances—demands, leakage, and transfers—are in reasonable agreement for both the model and the real-world network for the specified time period.
To determine the performance of the current network, and to validate that a calibration exercise needs to take place, compare the simulated pressure and flows with observed values:
- Simulated values are from the results of a normal hydraulic simulation.
- Observed values are provided by a live data configuration.
Compare the live and predicted results using either graphs or grid reports:
- Observed vs Predicted Reports allow comparison of summary flow, pressure, or reservoir depth for all network objects of an appropriate type in the model that are linked to live data.
- Simulation Graphs allow comparison between observed and predicted data for all the selected objects of appropriate type that are linked to live data.
To produce an observed versus predicted report:
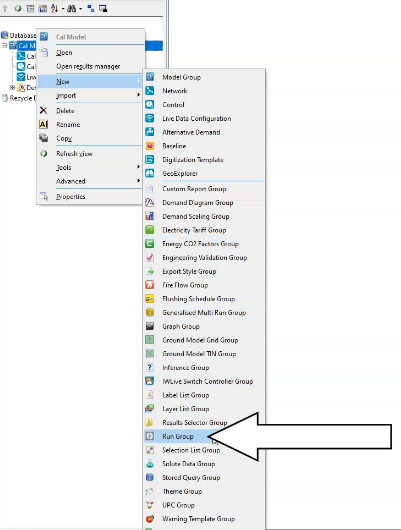
- Create a new Run Group object.
- In the Model Group, right-click the Calibration Model model group.
- Select New > Run Group.
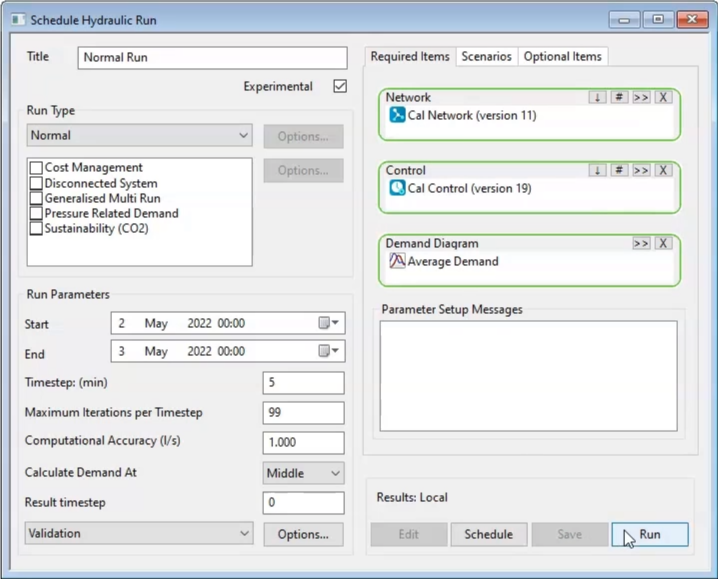
- Right-click the new run group and select New > Run.
- The Schedule Hydraulic Run dialog box opens.
- In the Title field, type, “Normal Run”.
- Check the box next to Experimental.
- From the Model Group, drag and drop the Calibration network into the Network panel in the dialog box.
Note: The Control and Demand Diagram panels populate as well.
- Click Save.
- Click Run.
To produce the observed versus simulated grid:
- Double-click Cal Control simulation results.
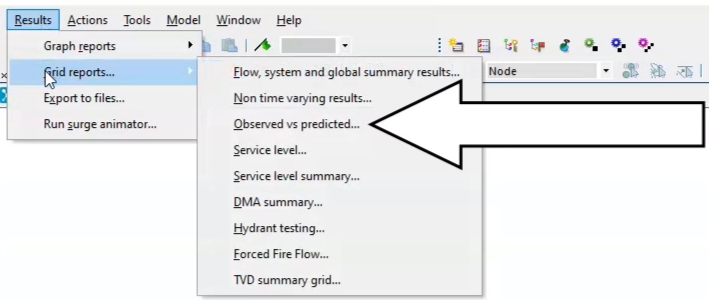
- Expand the Results menu.
- Select Grid report… > Observed vs predicted….
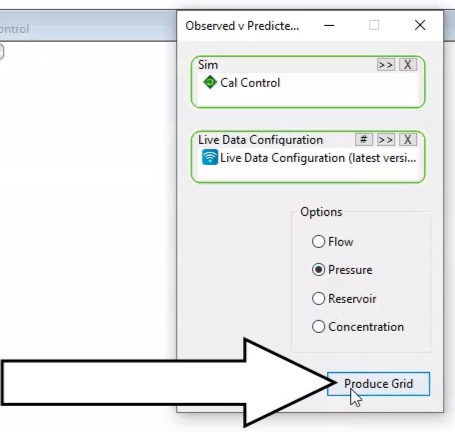
- The Grid Report (Observed vs Predicted) dialog box appears.
- From the Model Group, drag and drop the Normal Run simulation into the Sim panel.
- Drag and drop the live data configuration into the Live Data Configuration panel.
- Under Options, enable Pressure.
- Click Produce Grid.
A table appears. Two points have a Fair verdict:
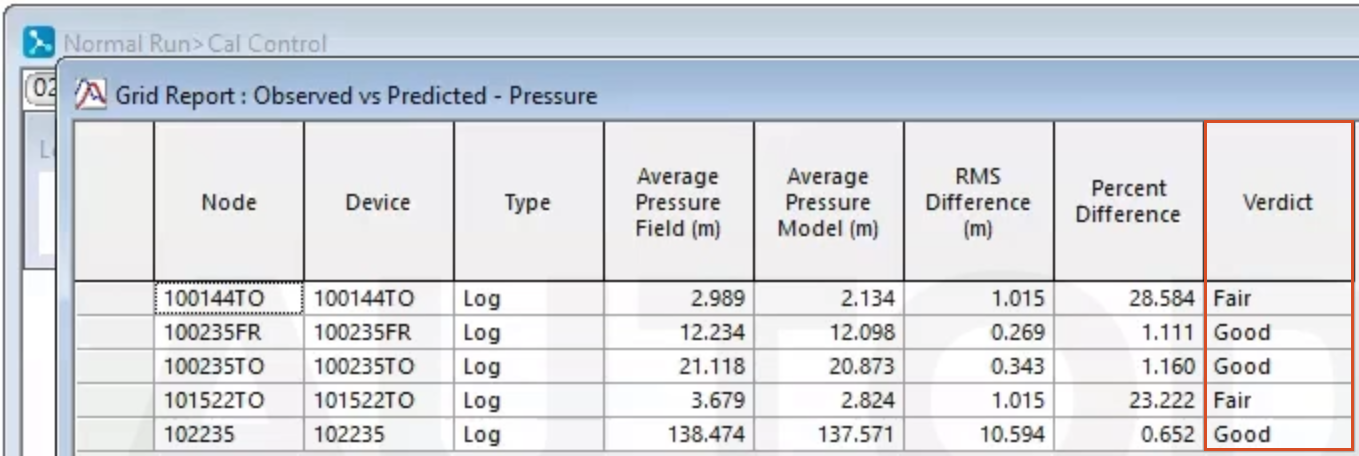
Therefore, running the automatic calibration module may improve the performance.


