& Construction

Integrated BIM tools, including Revit, AutoCAD, and Civil 3D
& Manufacturing

Professional CAD/CAM tools built on Inventor and AutoCAD
Run an MSQ simulation and analyze the MSQ results.
Tutorial resources
These downloadable resources will be used to complete this tutorial:
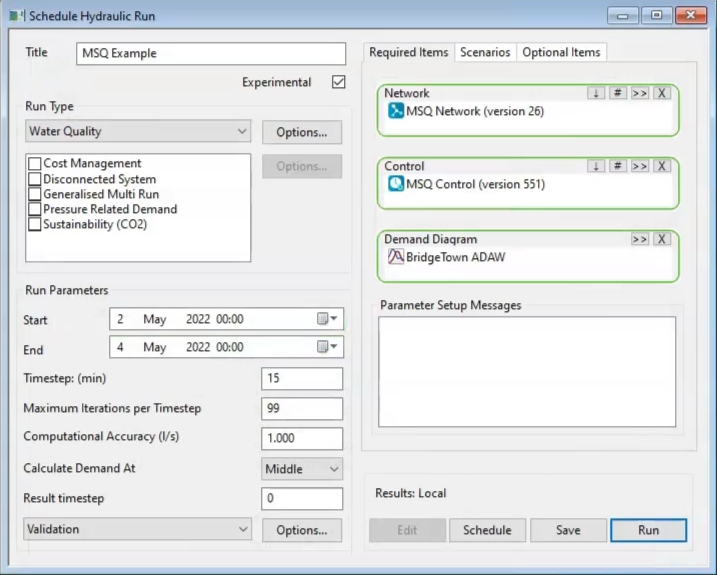
When performing a multi solute water quality simulation, after the MSQ model has been set up using the Solute Data Object dialog box, and after the network has been dosed with the contaminants, you can configure and run the MSQ simulation.
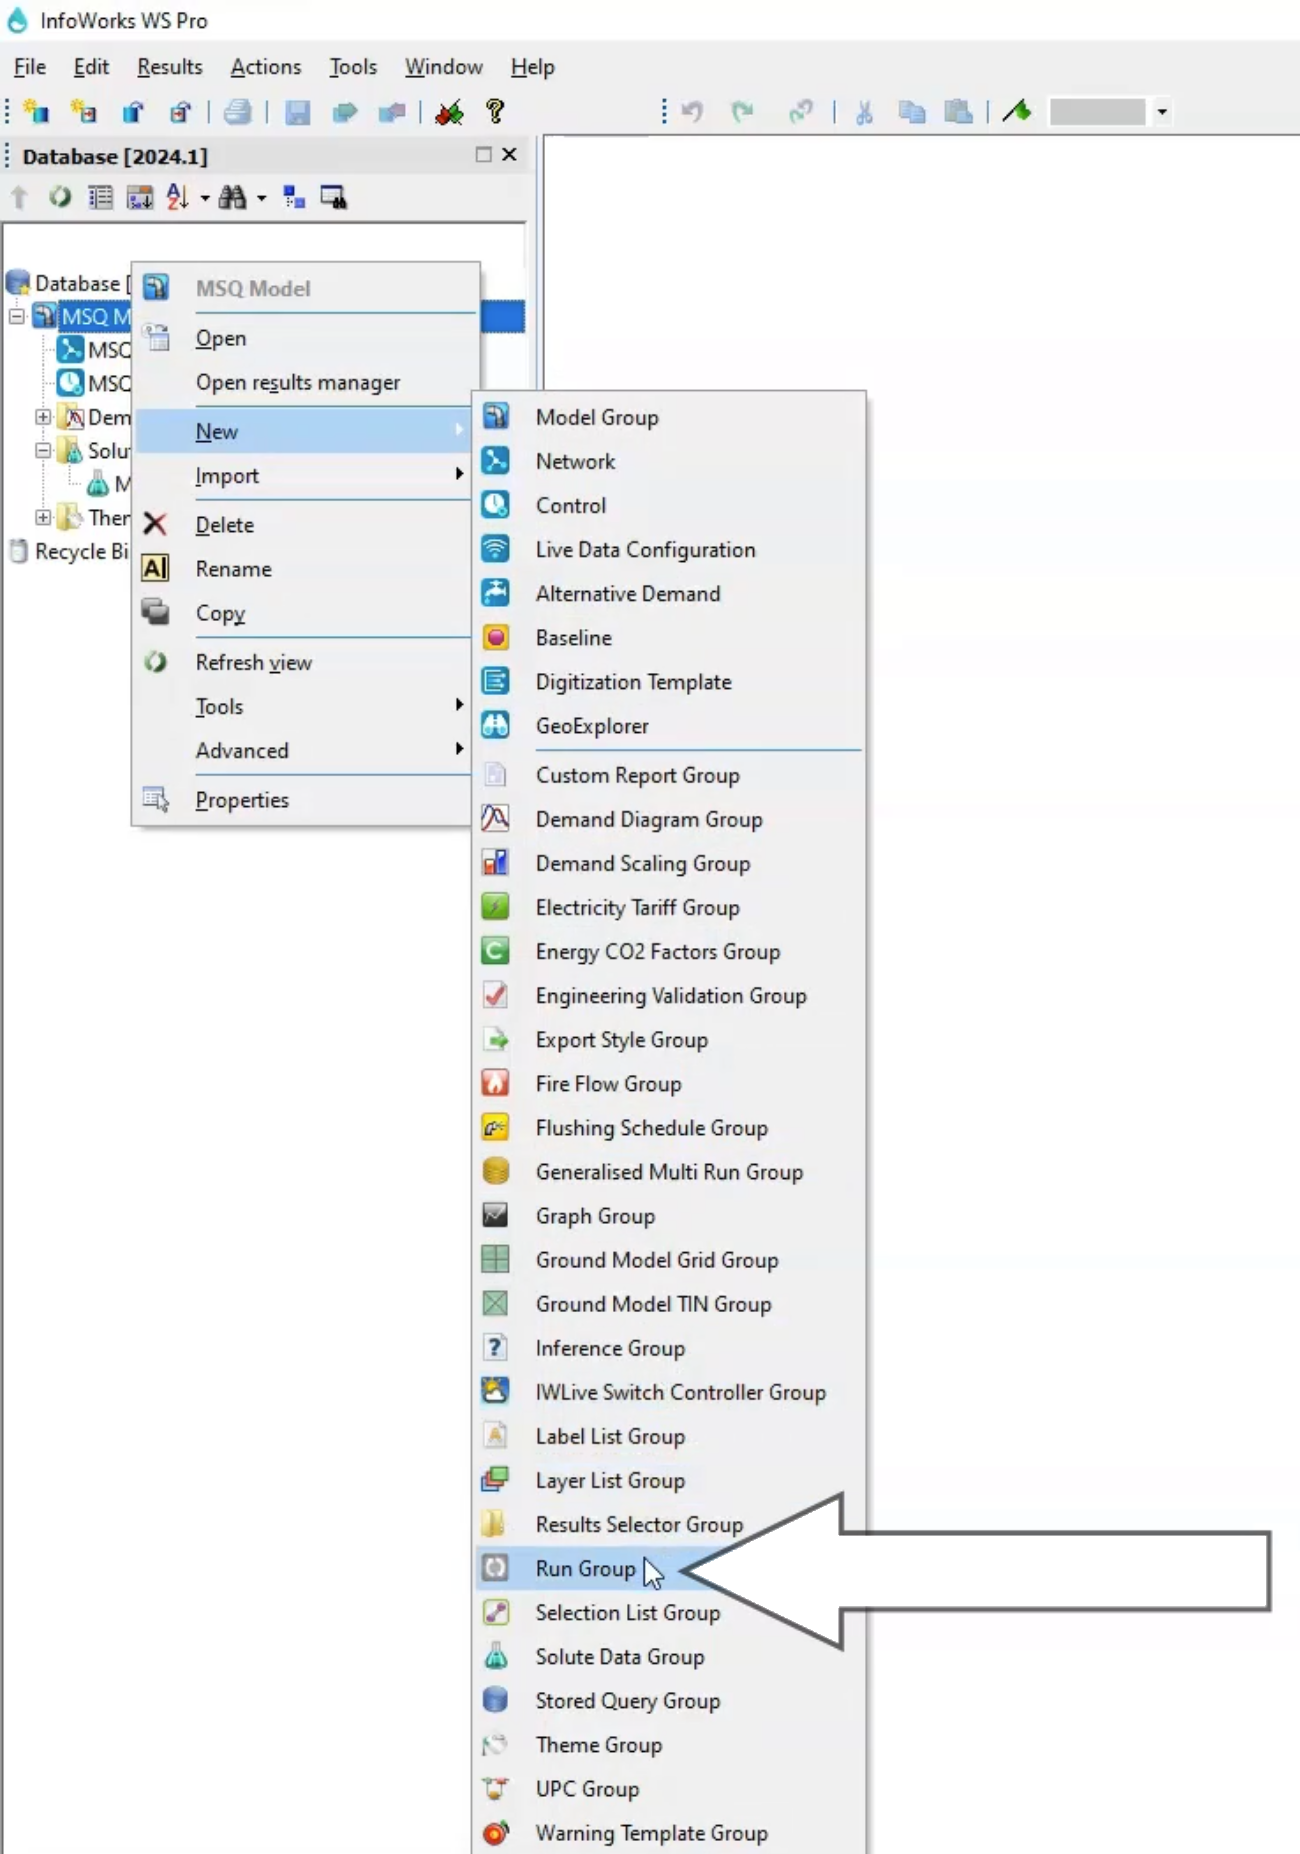
The Control and Demand Diagram boxes populate automatically.
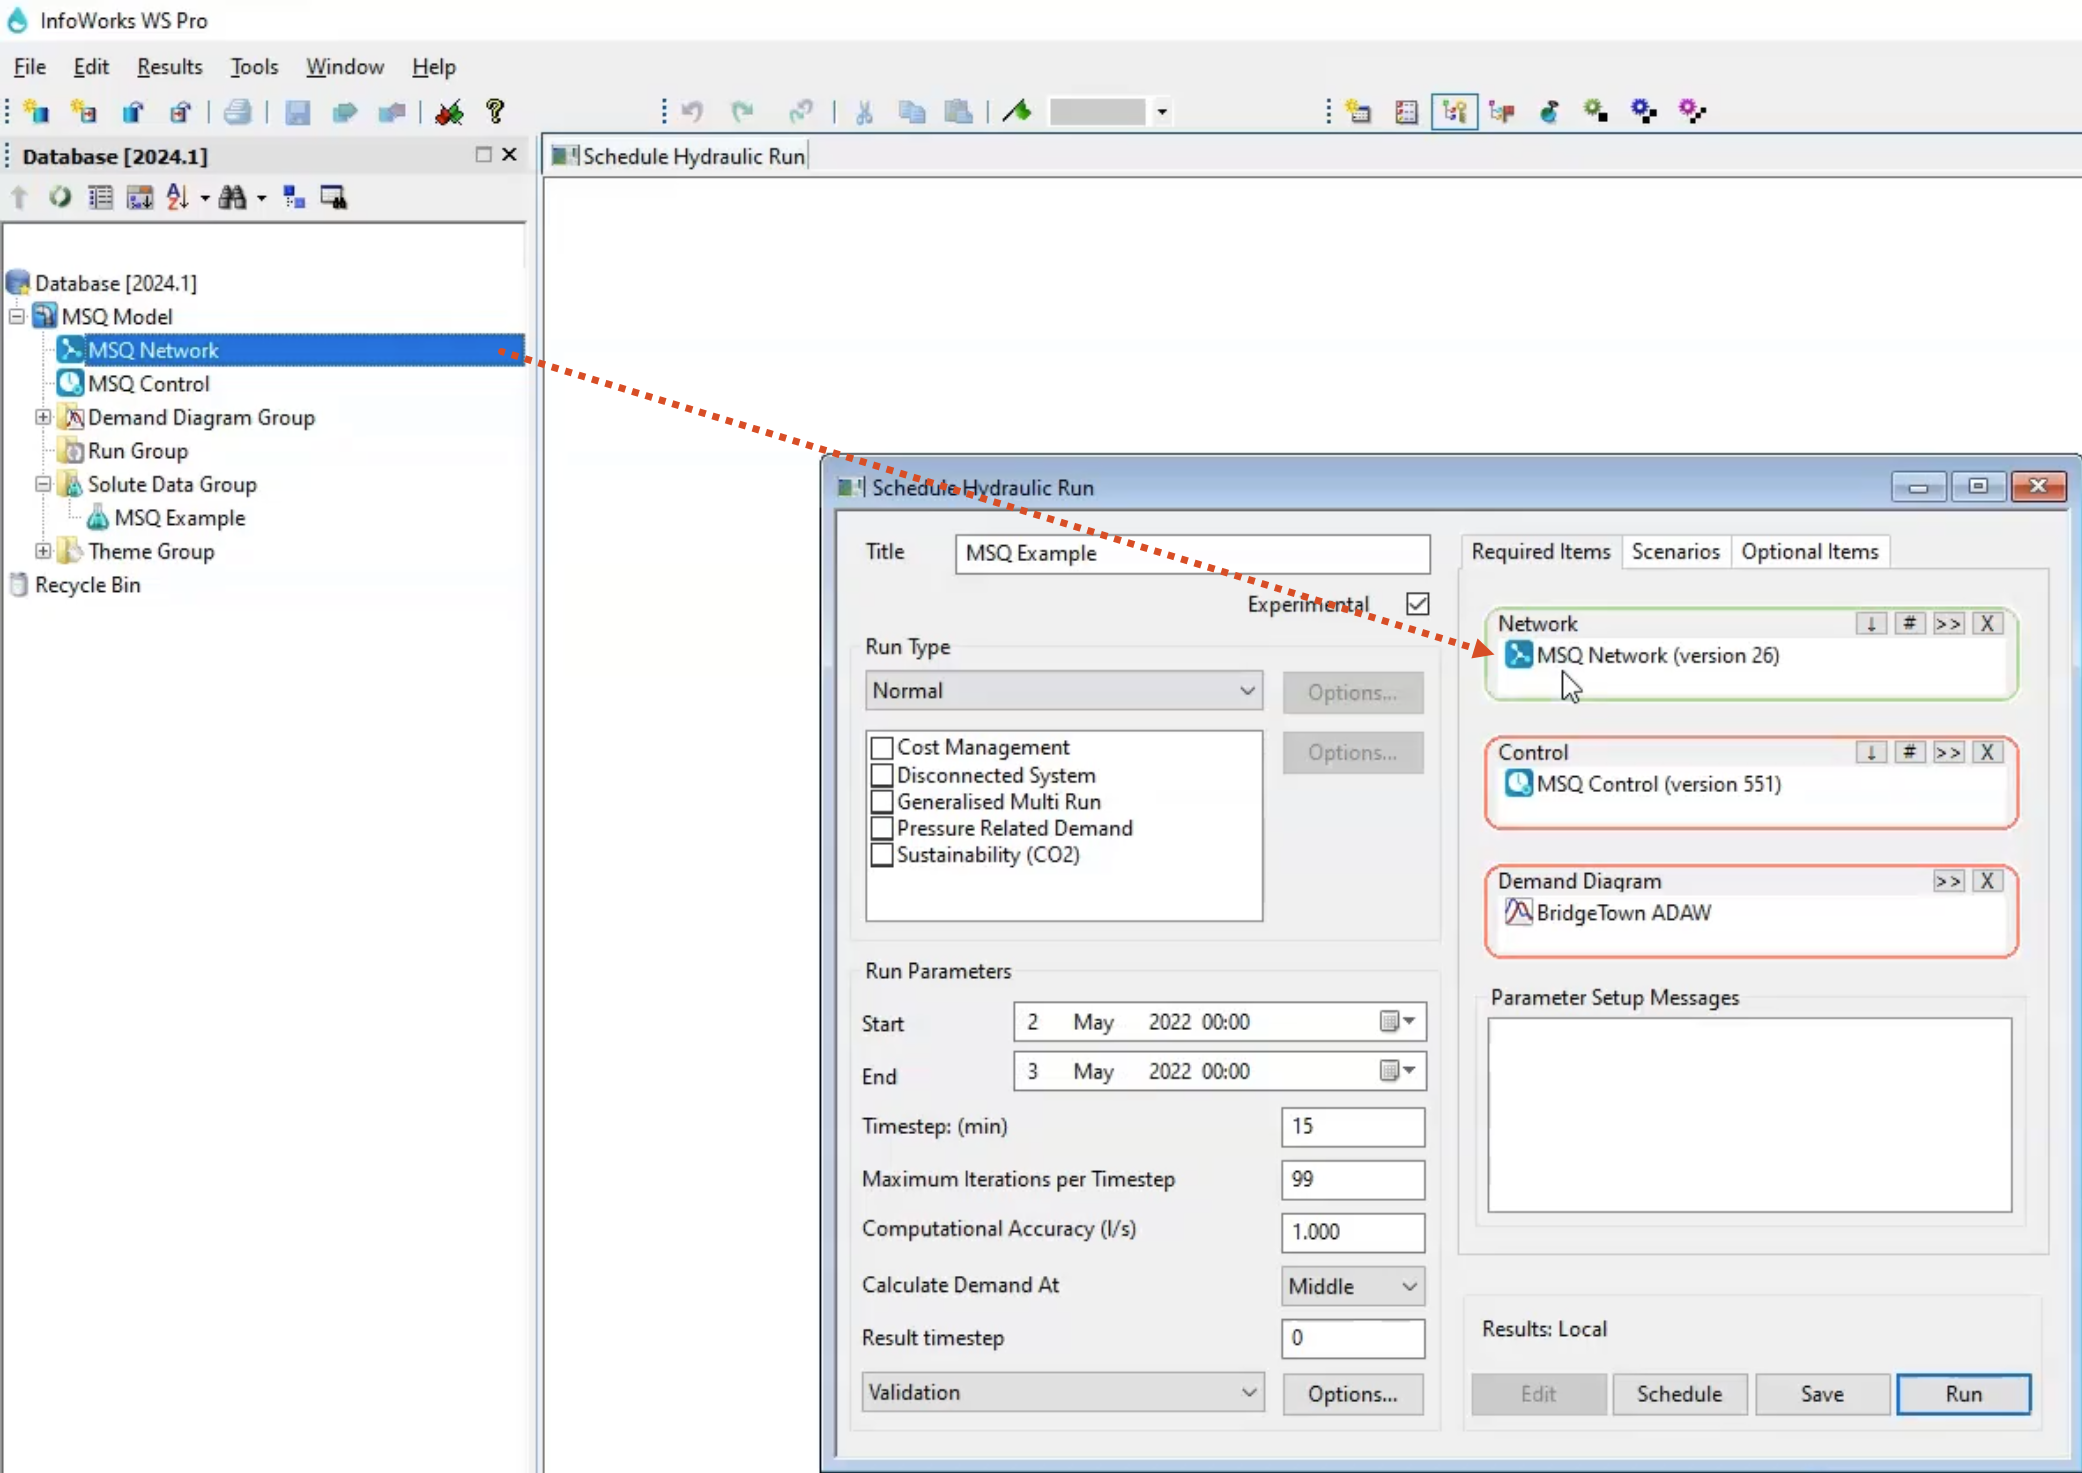
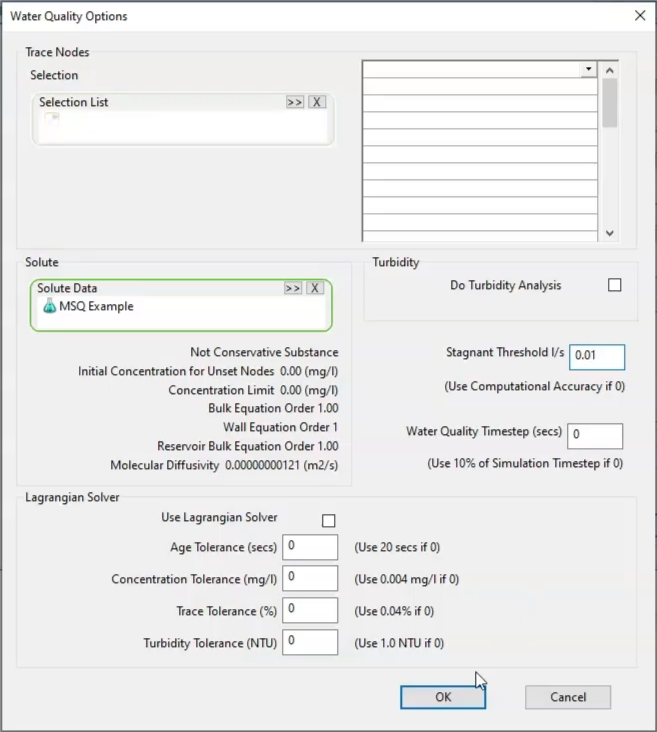
Note that you can reopen the Water Quality Options dialog box from the Schedule Hydraulic Run dialog box, Run Type group box, by clicking the Options button.
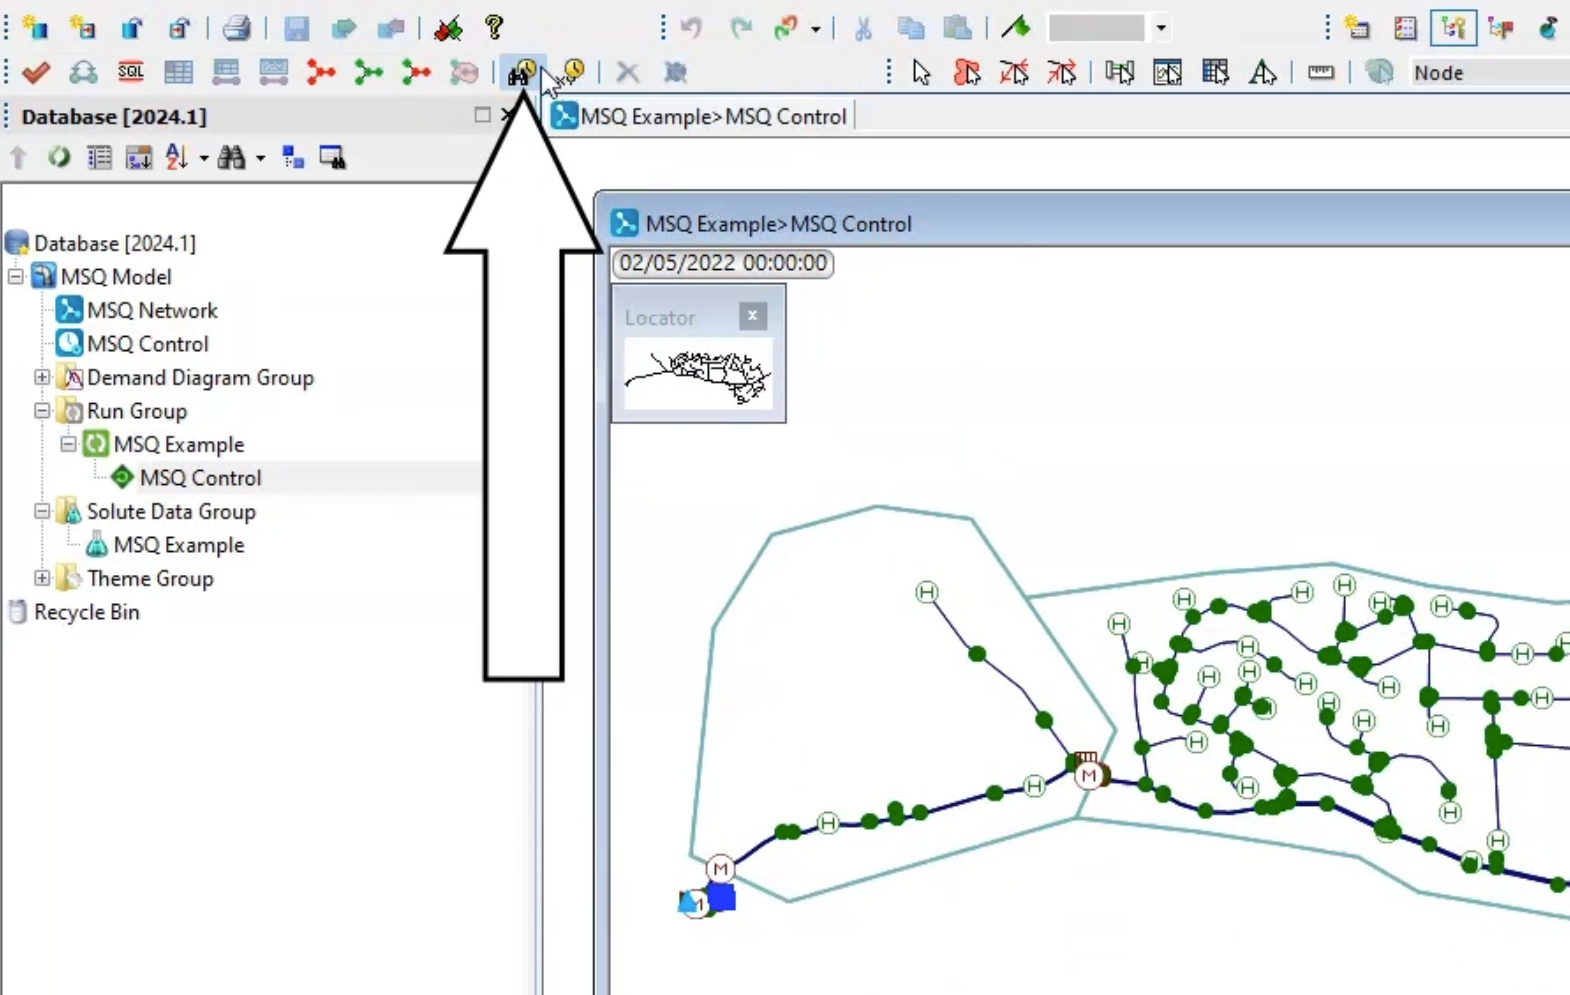
In the Model Group, the simulation results now appear under the MSQ Example run.
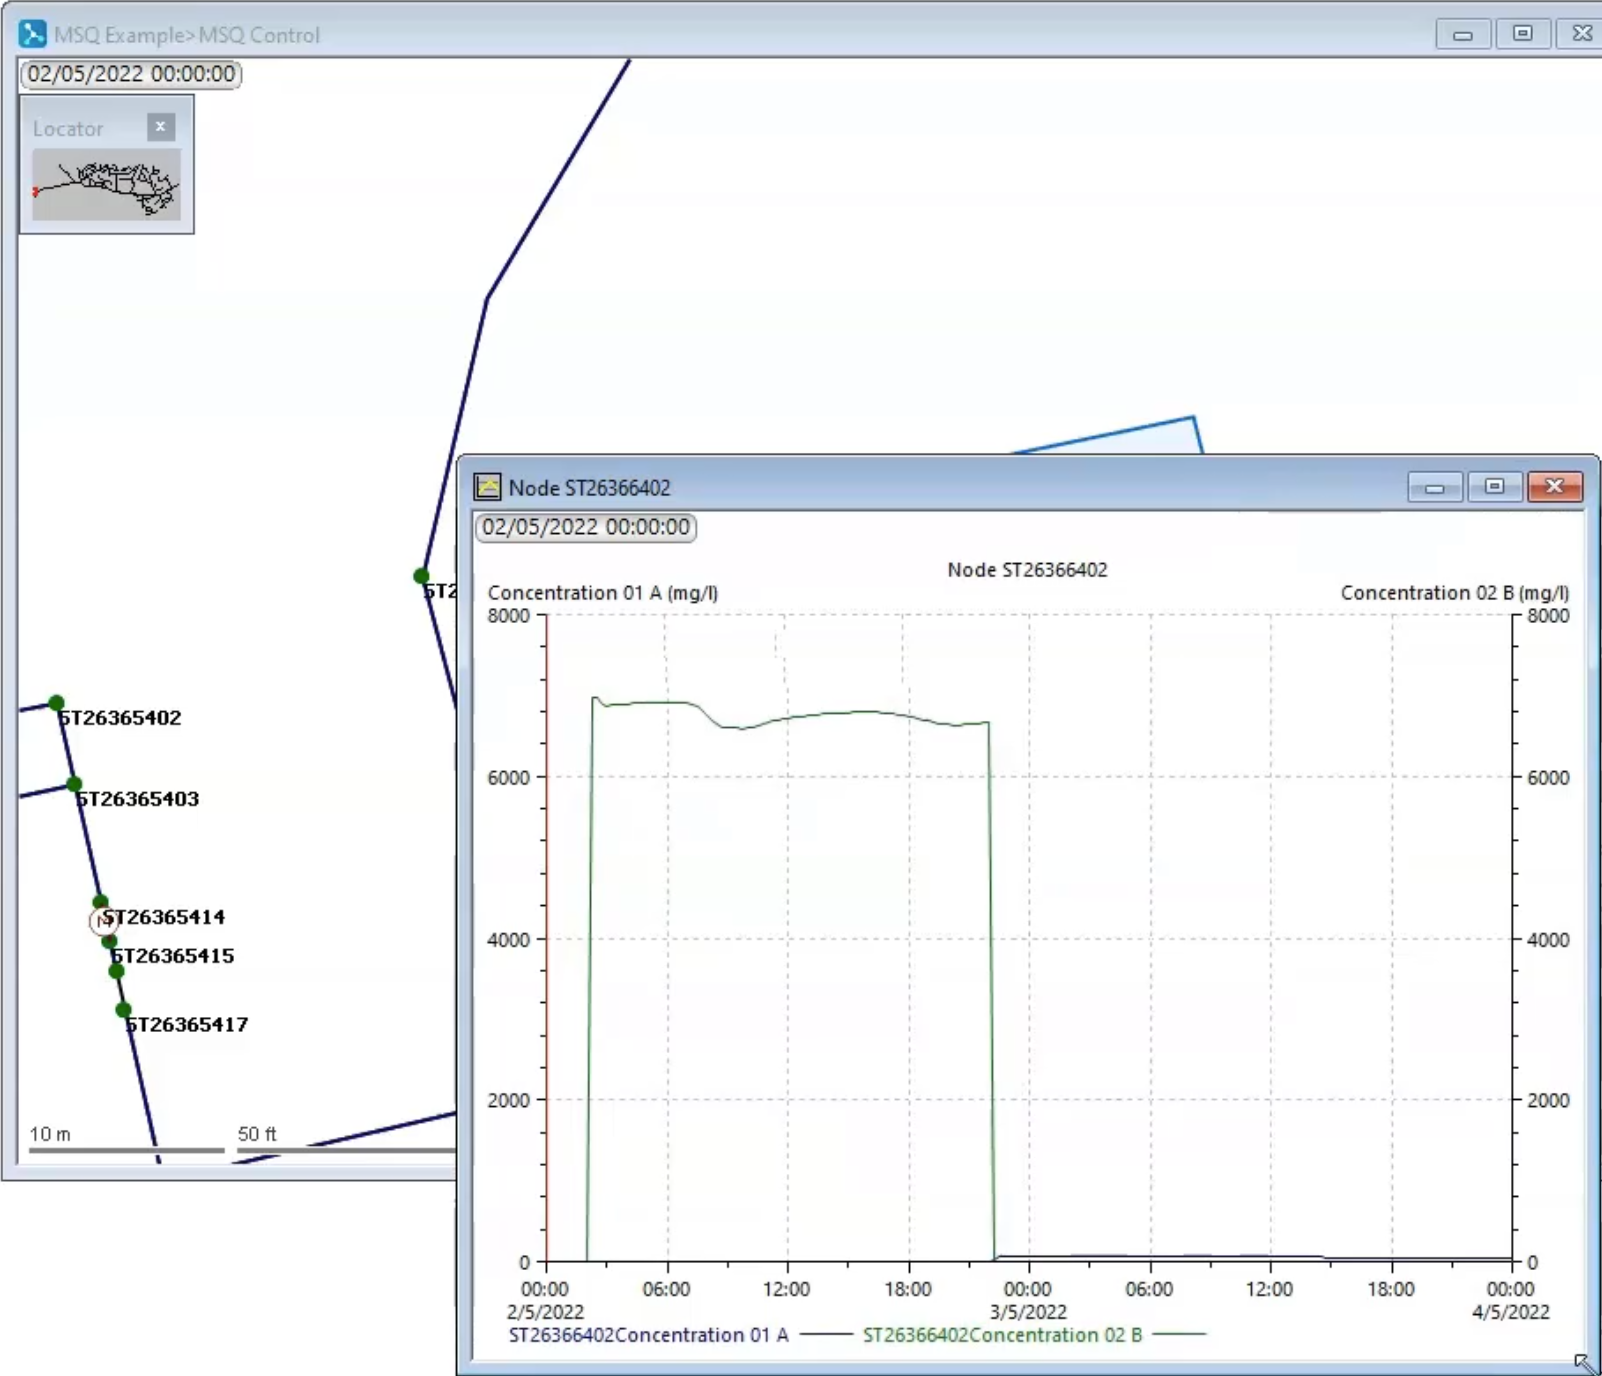
To graph the results:
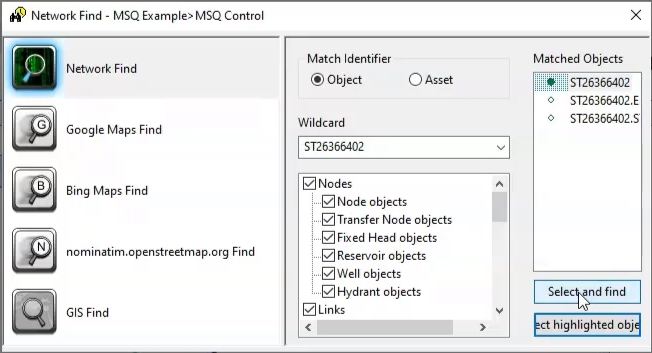
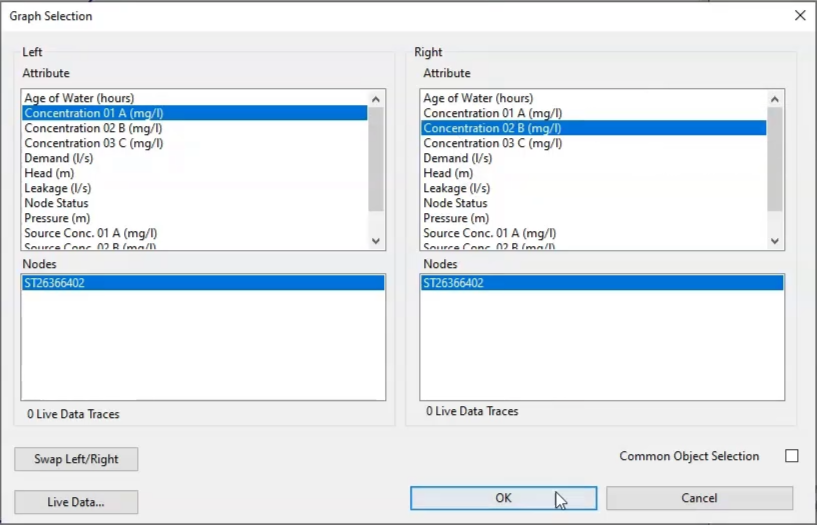
On the graph, you can see the concentration of the two contaminants at the point below the reservoir across the simulation.
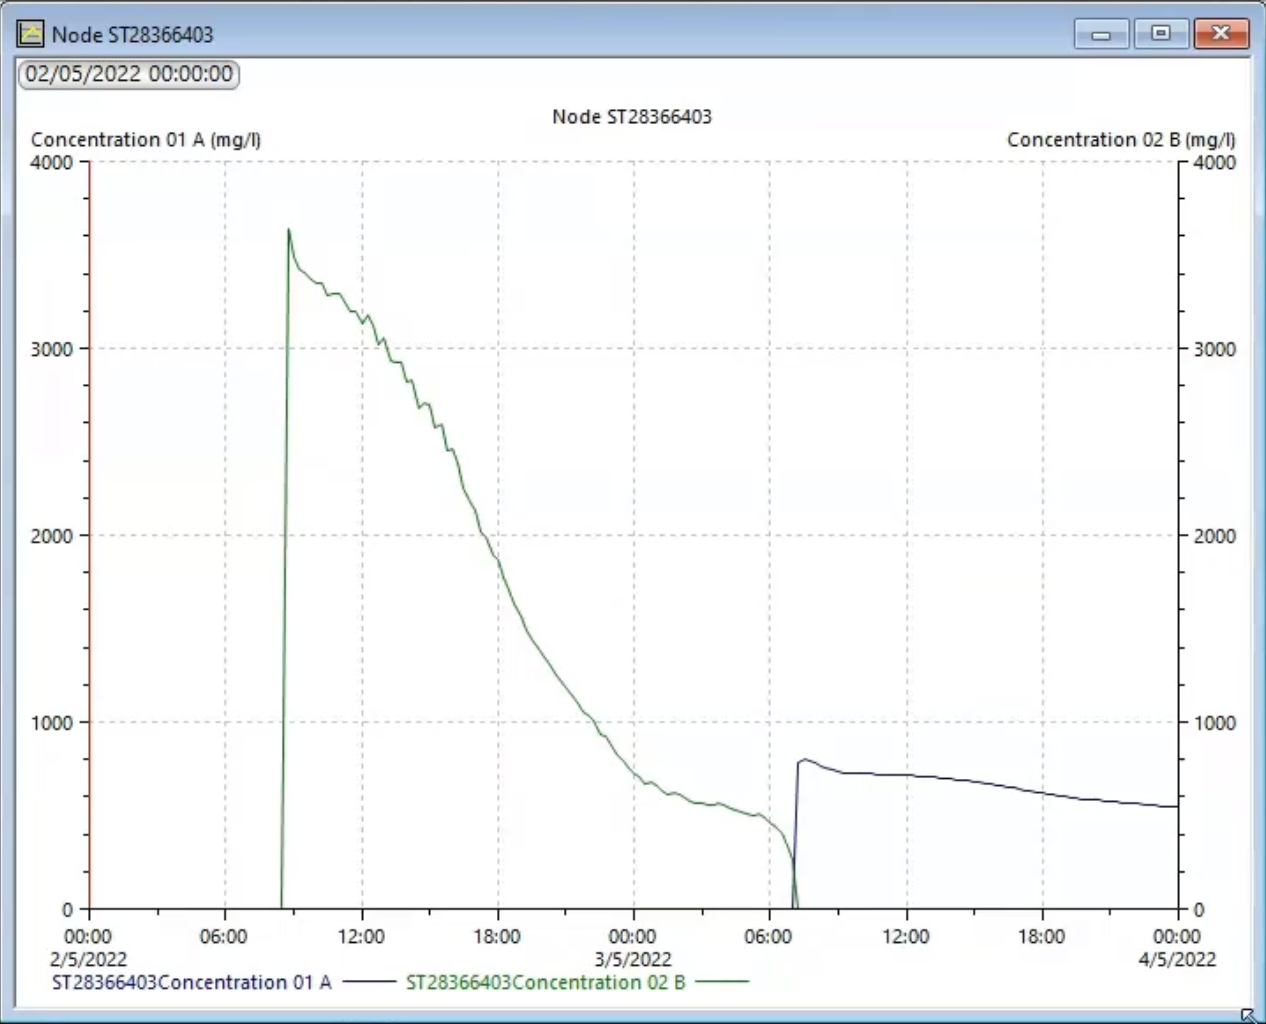
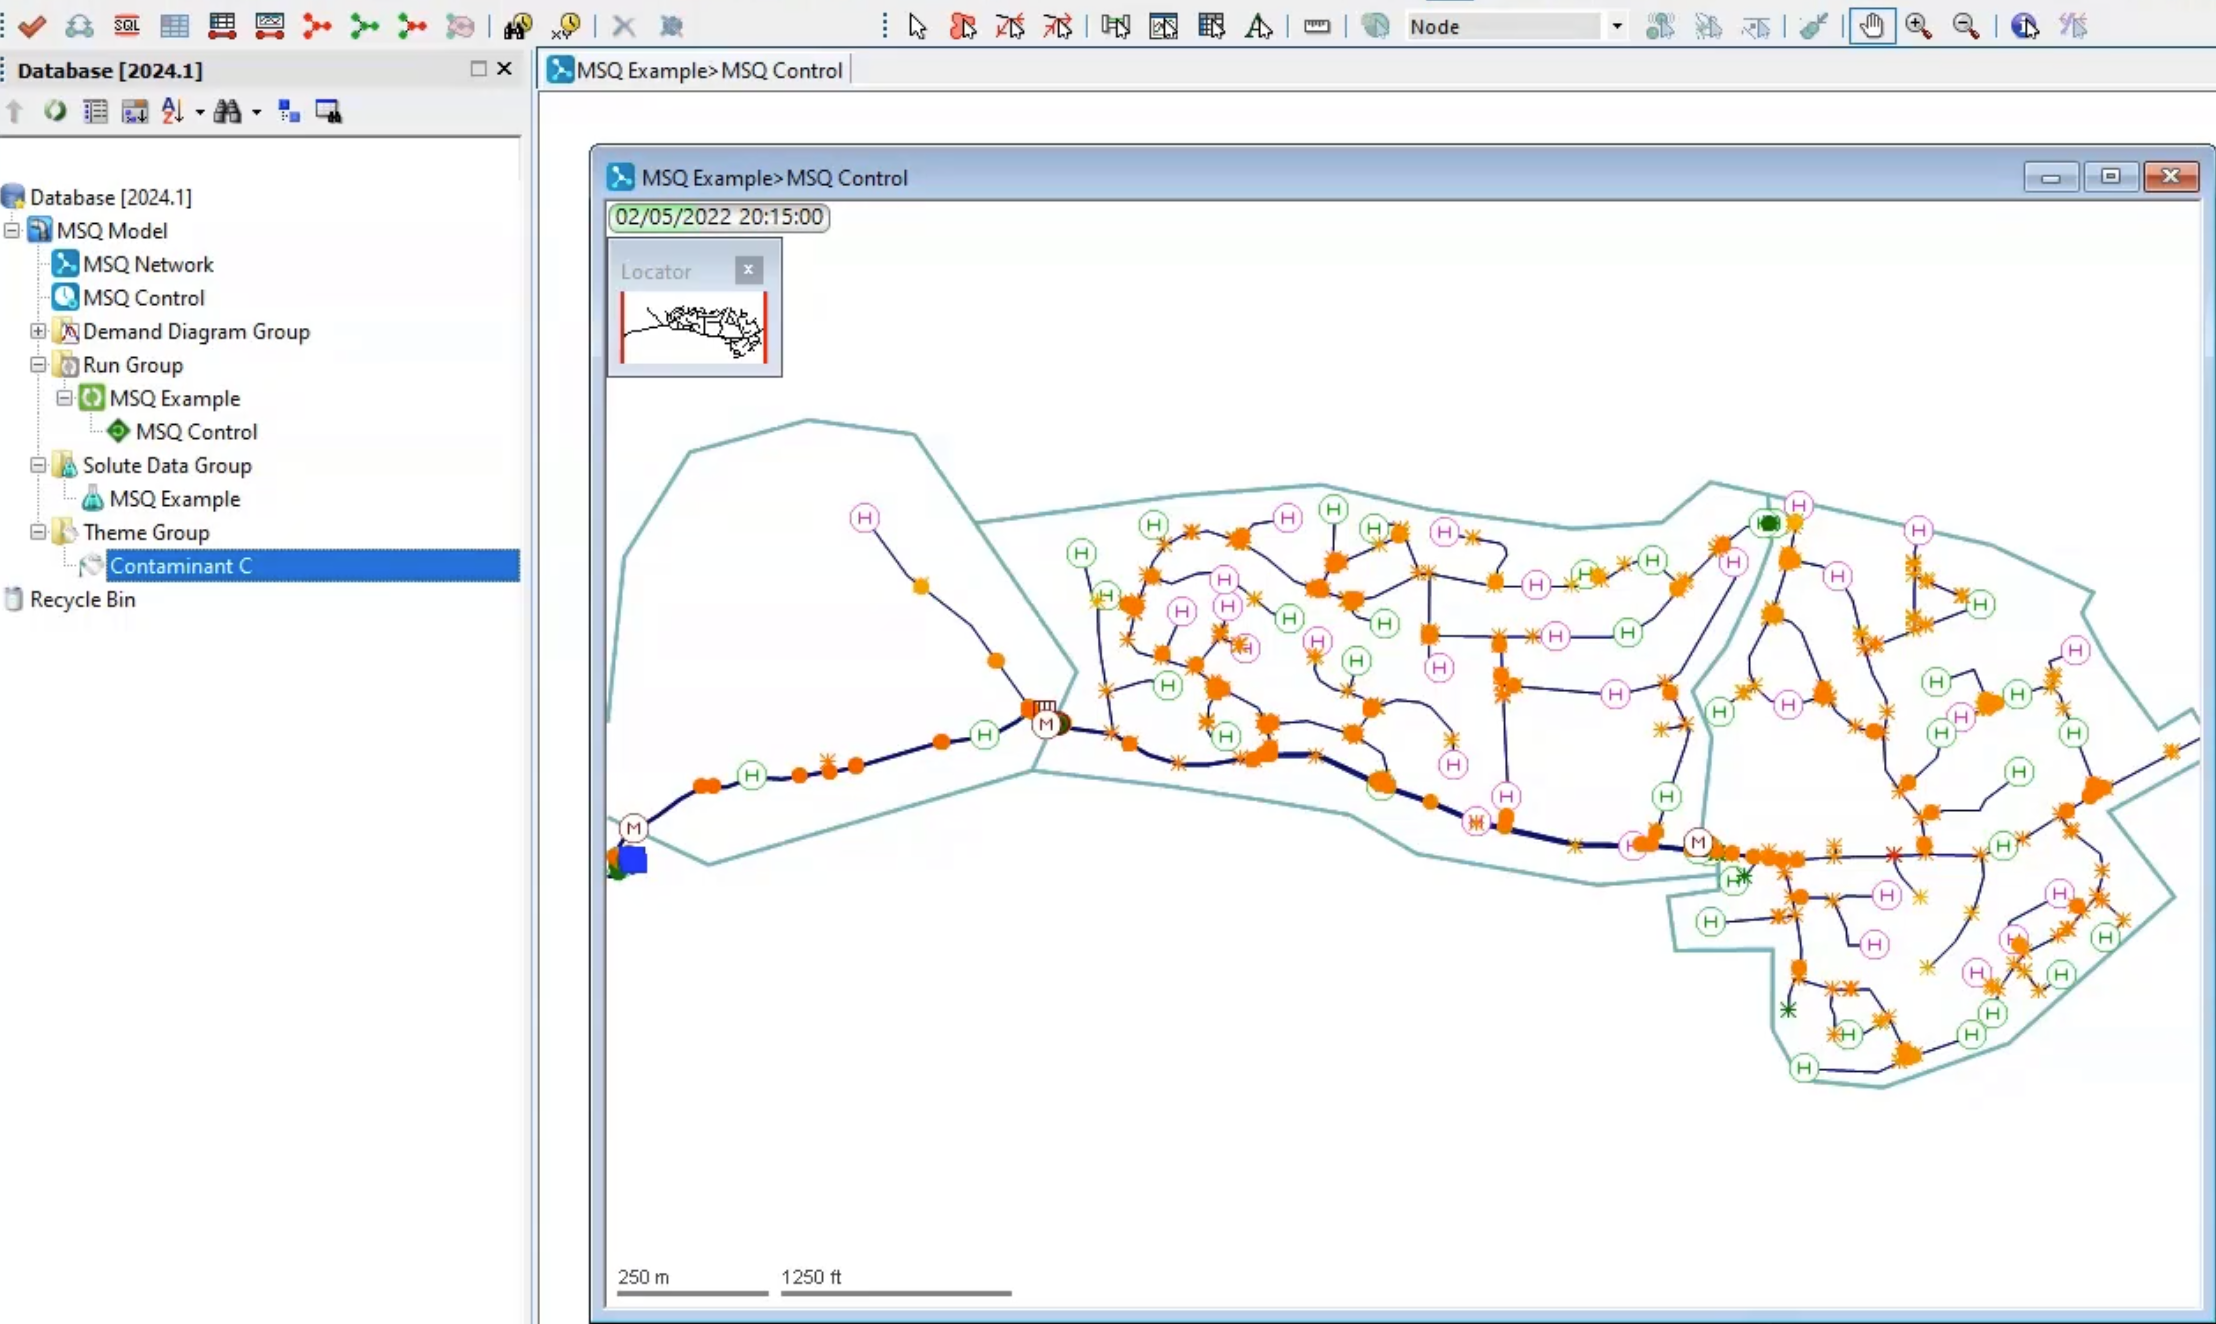
To see how Contaminant A and B react to form Contaminant C across the network:
