 AutoCAD
 AutoCAD LT
 Fusion
 AutoCAD Revit LT Suite
 Architecture, Engineering & Construction Collection
 Revit
Revit Civil 3D
 BIM Collaborate Pro
 Product Design & Manufacturing Collection
 Maya
Maya Inventor
 Navisworks
 3DS Max
 Fusion Extensions
Review steady state simulation results using the Report Manager.
Tutorial resources
These downloadable resources will be used to complete this tutorial:
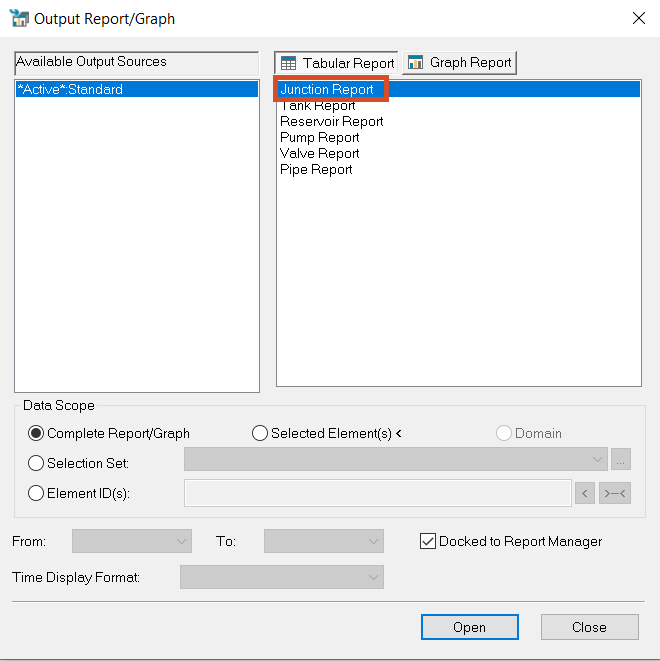
After a steady state simulation has been run successfully, you can use the Report Manager to view different reports from your simulation in both tabular and graph formats.


A table appears that contains one record for each junction node in the current InfoWater Pro project. To sort the results:

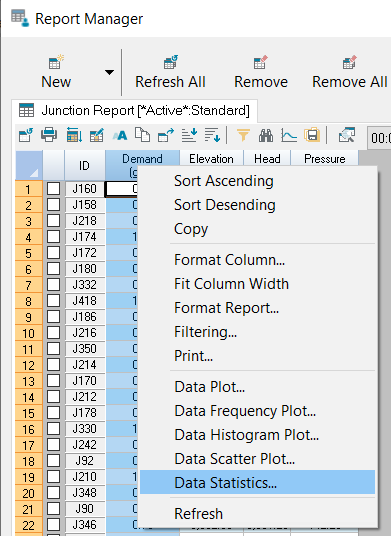
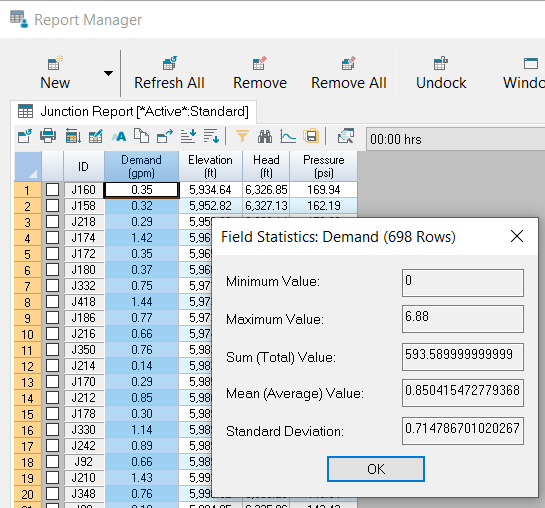
To access the data submenus:

These numbers show you information such as the highest demand (Maximum Value) and the total demand in the system.

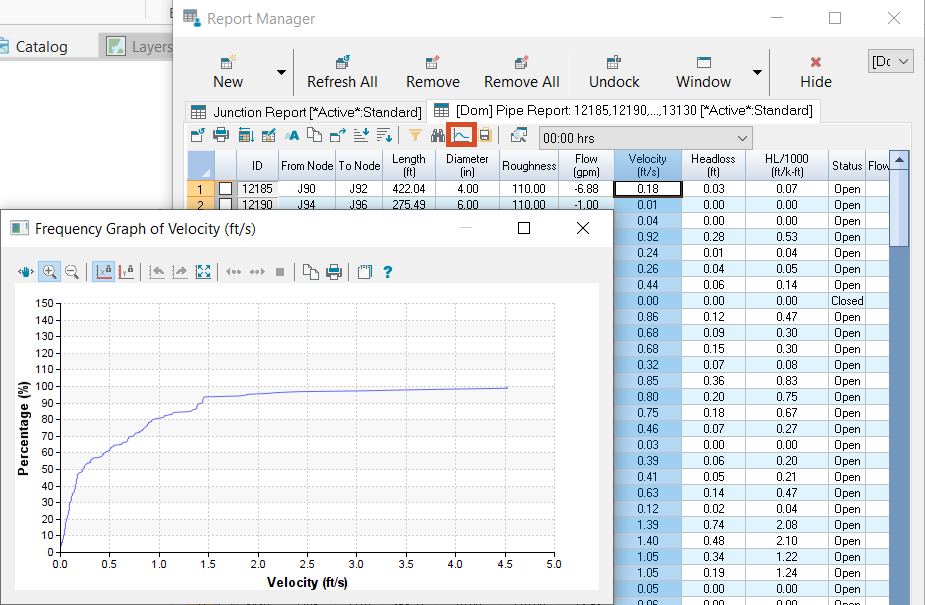
To view reports or graphs based on a selection within the model:


The Report Manager populates with a table that contains only the data for the pipes you just selected. To see their velocity data:

