 AutoCAD
 AutoCAD LT
 Fusion
 AutoCAD Revit LT Suite
 Architecture, Engineering & Construction Collection
 Revit
Revit Civil 3D
 BIM Collaborate Pro
 Product Design & Manufacturing Collection
 Maya
Maya Inventor
 Navisworks
 3DS Max
 Fusion Extensions
Color code various attribute values to view simulation results in the map display.
Tutorial resources
These downloadable resources will be used to complete this tutorial:
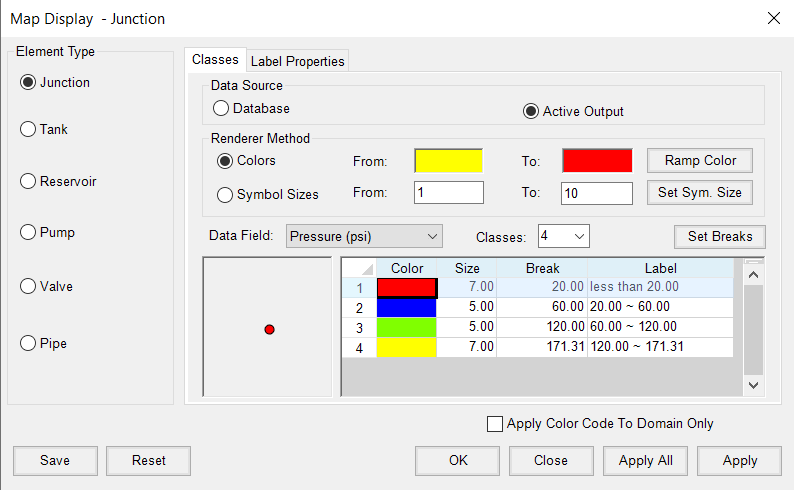
To help you visualize steady state simulation results, you can create a color-coded thematic map based on attribute values.

In the Map Display dialog box, you can configure the map theme to display the needed information:

To color-code the pipes also:


Note: This example is based on a steady state analysis, therefore, this is just a snapshot in time for this system. It is also possible to create a thematic map based on a time varying output.
