 AutoCAD
 AutoCAD LT
 Fusion
 AutoCAD Revit LT Suite
 Architecture, Engineering & Construction Collection
 Revit
Revit Civil 3D
 BIM Collaborate Pro
 Product Design & Manufacturing Collection
 Maya
Maya Inventor
 Navisworks
 3DS Max
 Fusion Extensions
Create contours to illustrate spatial variability in your model.
Tutorial resources
These downloadable resources will be used to complete this tutorial:
Contours are a collection of polylines that illustrates the spatial variability for an InfoWater Pro model. Contours can be generated for any numeric junction-based model input field or simulation result variable.
To create pressure contours for a steady state simulation result as a method of visualizing the results:

All junctions in the map are now displayed in red.


This junction is removed from the domain because, in this particular model, it is so close to the reservoir that it has an artificially reduced pressure, which would affect the contour lines. Removing it from the domain ensures the contour lines will be more accurate.
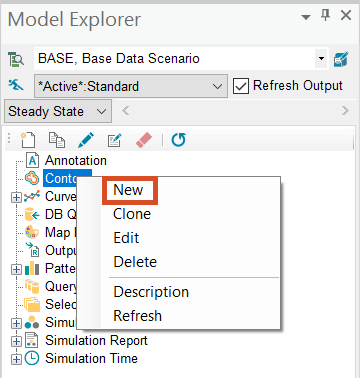
To create the contours:


To manually set the values for the color ramp:


Note: Contours are generated as an external shapefile and can be displayed at any time before or after a simulation run. Also be aware that they are saved as a permanent layer of an InfoWater Pro project.
