Get help with Account management
Account management for admins
Balances
The Balances page in Autodesk account shows real-time balances and usage data for Flex tokens and shared cloud credits.
Flex token balance and usage data
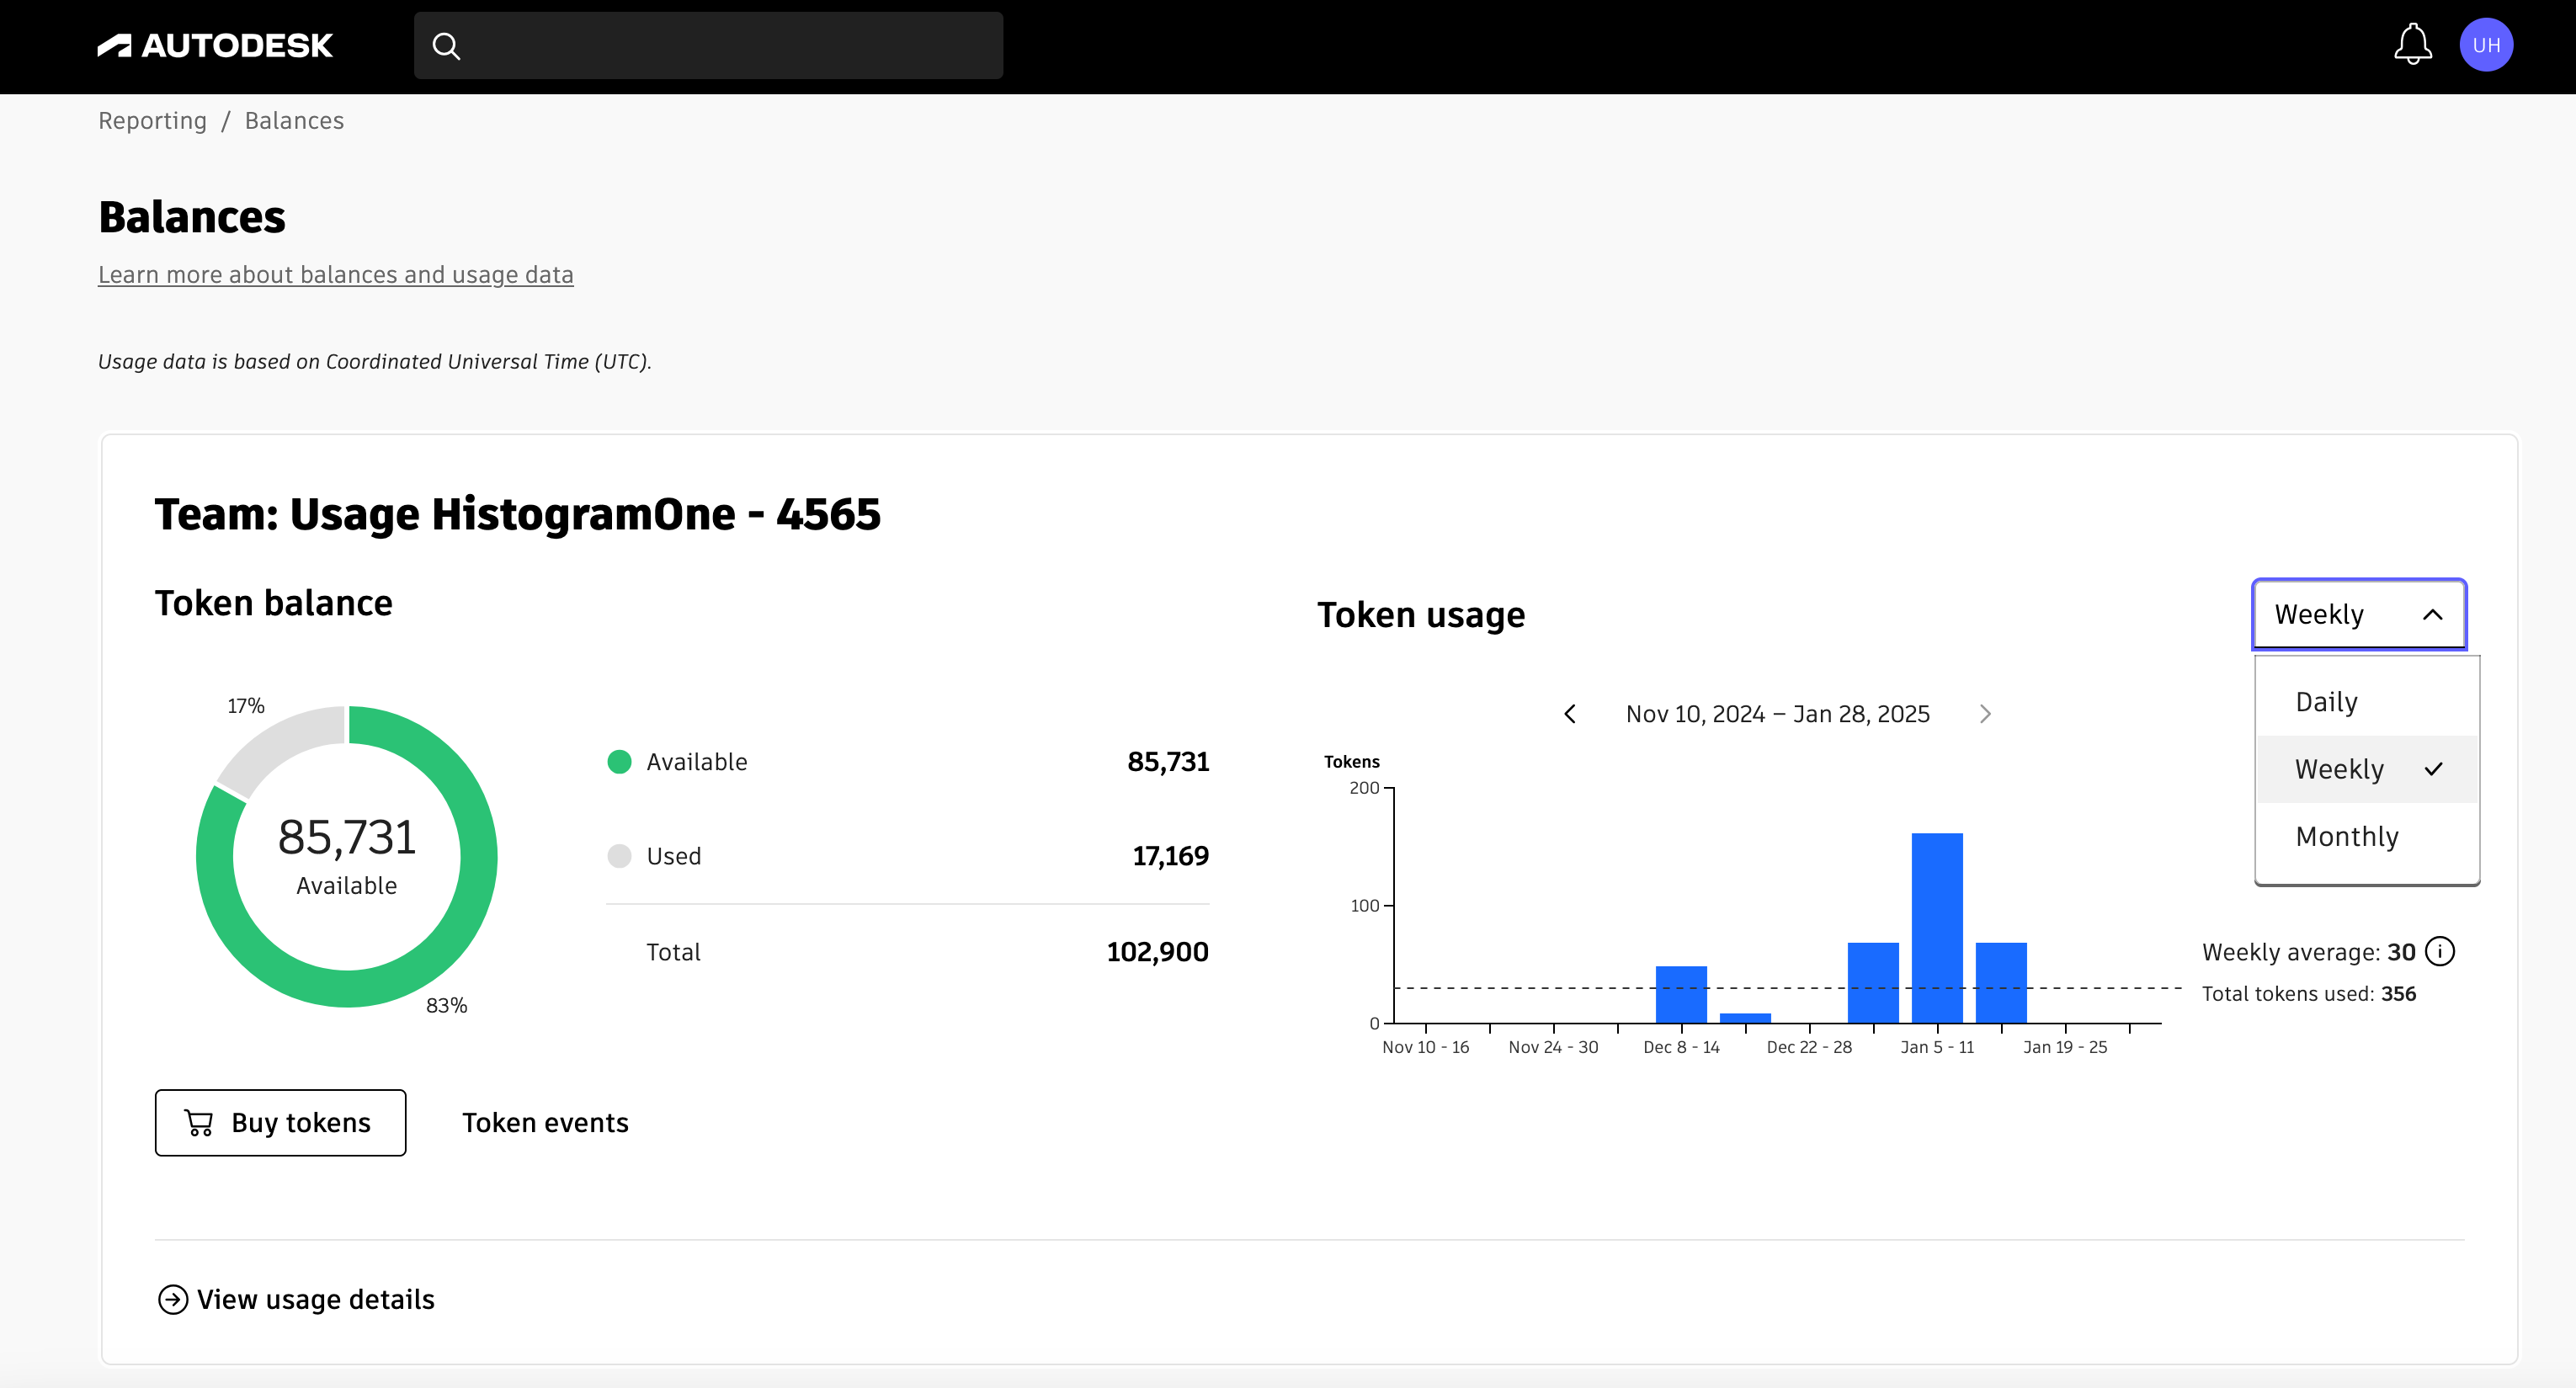
The Balances page provides a visualization for each of your teams that shows:
Tokens available
Tokens used
Total tokens purchased
Green and red bands in the donut chart indicate that available tokens exceed 20% of the total purchased or are fewer than that.
The Balances page also provides access to token usage information for each of your teams.
Usage. To the right of the donut chart, you’ll see a drop-down menu with options for a daily, weekly, or monthly usage bar chart:
Hover over a specific daily, weekly, or monthly bar to see usage for the top five products.
The bar chart also shows the daily/weekly/monthly average versus total tokens used in the period.
Token events. Below the chart, click Token Events to see a list showing when tokens expired, were purchased, or moved between teams.
Expiring tokens. This information helps you keep track of the number of days your team has left to use your tokens. This will assist you in planning how to utilize your tokens effectively. You’ll receive an alert when any team’s tokens are set to expire within the next 90 days.
To learn more, view the video that follows.
Shared cloud credit balance and usage data
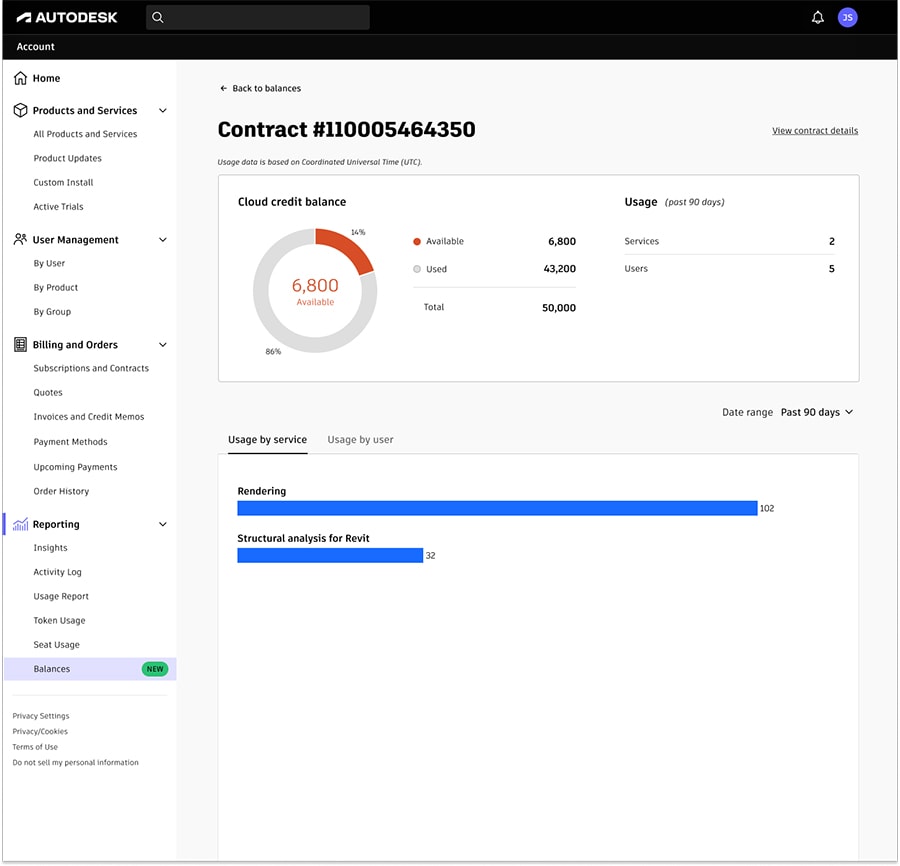
If you’re in a region in which Flex is not yet supported, the Balances page provides real-time shared cloud credit balances. A chart for your contract shows you the current number of:
Shared cloud credits available
Shared cloud credits used
Total shared cloud credits purchased
Green and red bands in the donut chart indicate that available shared cloud credits exceed 20% of the total purchased or are fewer than that.
In addition to shared cloud credit balance, the Balances page provides access to usage information for your contract.
Usage. To the right of the donut chart, you’ll see usage information for the past 90 days:
Number of products for which your team has used shared cloud credits
Number of users who have utilized shared cloud credits
Usage details. At the bottom of the Balances page, click View Usage Details to see a bar chart showing usage by service and usage by user for the past 90 days. You can also specify a custom time range.
Related resources
Need help? Ask the Autodesk Assistant!
The Assistant can help you find answers or contact an agent.
What level of support do you have?
Different subscription plans provide distinct categories of support. Find out the level of support for your plan.
View levels of support