Step-by-step Guide
In InfoWorks WS Pro, a demand area analysis provides data that allows users to review the current demand for water and project future potential demand areas.
To view and edit a list of Target Points within the selected demand area and review the results as a grid:
- Open the Demand Area Grid.
- Right-click Demand Area 35 and select Properties.
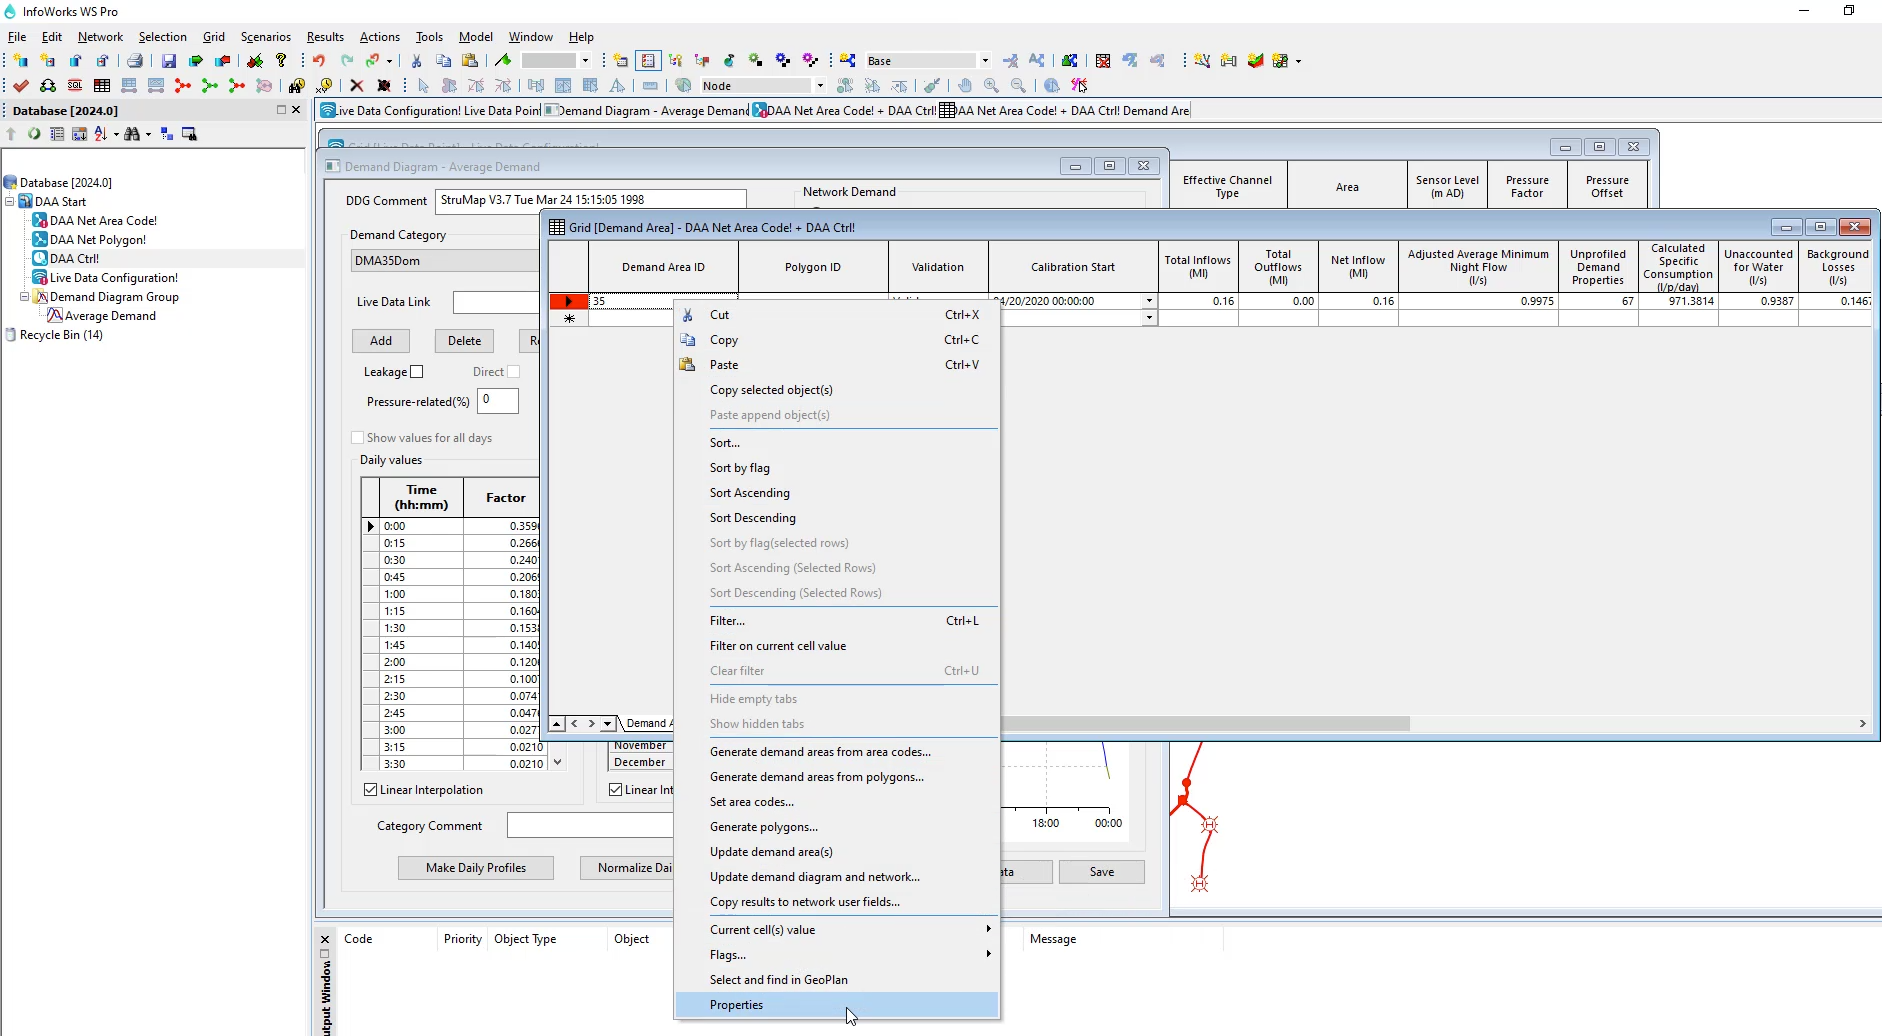
- In the properties dialog box, open the Target Points tab.
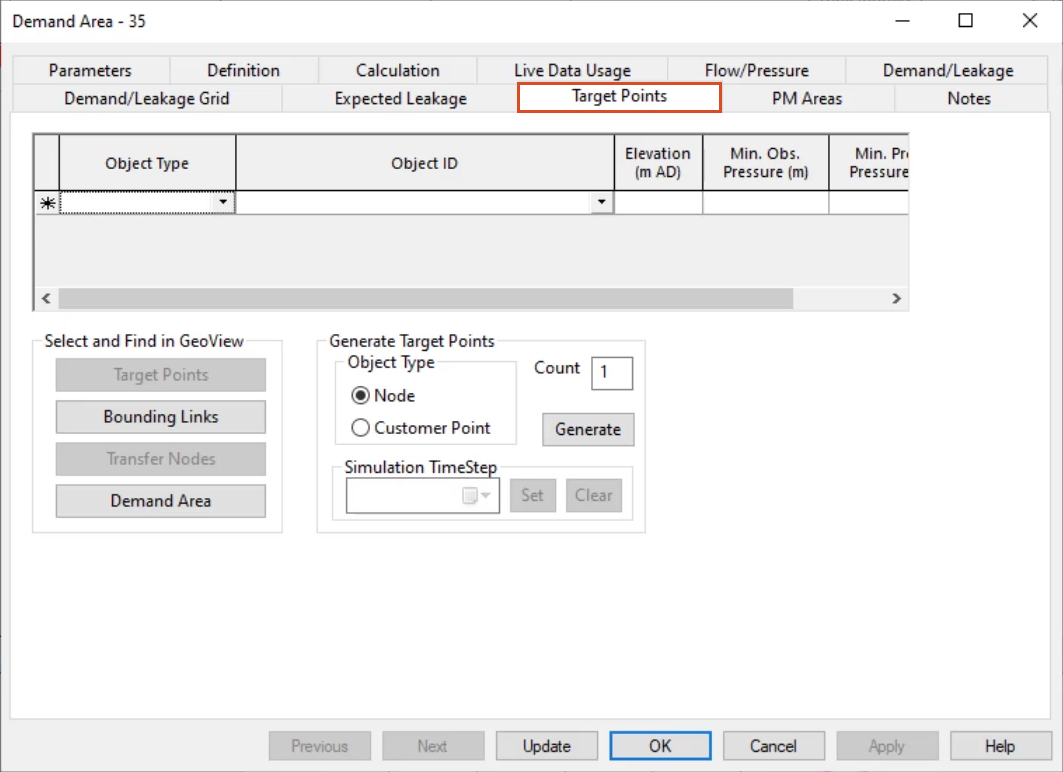
The Target Points list defines nodes or customer points for level of service monitoring. These points can be selected manually, or they can be generated automatically based on either snapshot pressure results or elevations.
Note: For the selection to be based on results, the simulation results must be based on the same network and control in current use. To do this, drag the results into the network and control view, so that they share the same window.
To generate a list of target points automatically:
- In the Generate Target Points group box, next to Count, specify the number of points to be generated, such as “1”.
- Under Object Type, select the type of point to be used. For this example, select Node.
- If there are simulation results open on the GeoPlan, click Set and select a Simulation TimeStep.
- Click Generate to generate a list of target points.
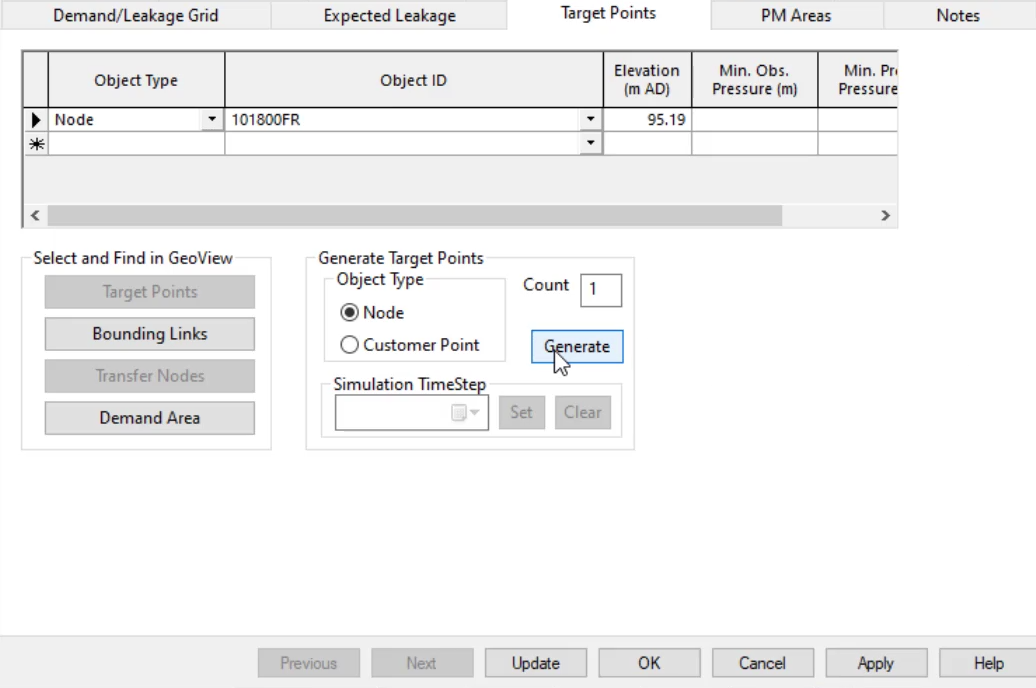
- Without simulation results: The list is generated by searching for the node or customer point with the highest elevation.
- With simulation results open on the GeoPlan: The list is generated by searching for the node/customer point with the lowest pressure at the timestep selected by the user.
To define a list of target points manually:
- From the Target Points grid, expand the Object Type drop-down and select Node.
- Expand the Object ID drop-down and select an object ID.
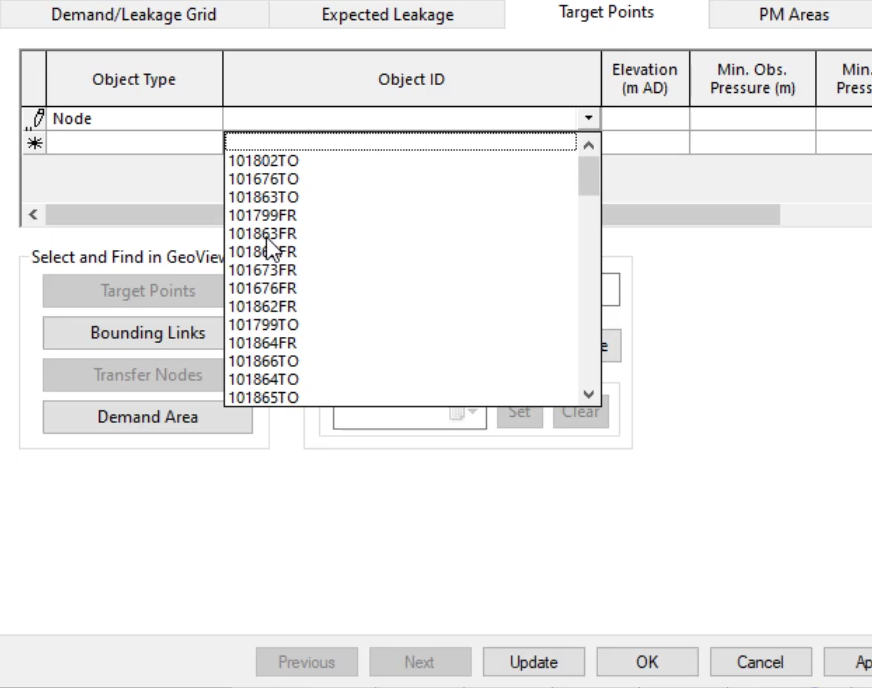
- Click Update to populate the Elevation field, Min. Obs. Pressure, and Min. Pred. Pressure columns.
Note: The Min. Obs. Pressure is calculated only if live data are available, and the Min. Pred. Pressure is calculated only if there are simulation results.


